Over the past 2 weeks, we have examined race and ethnic relations in the Eastern and Western regions of the United States. How do relations in these areas compare to those in the southern United States -- an area that has seen more than its share of racial conflict over the past two centuries? This week, we look at ���۴�ýPoll data on racial attitudes from the South*, as well as racial dissimilarity indexes for several areas in this region. (For a discussion of the CensusScope dissimilarity index, please see "U.S. Race Relations by Region: The East" in Related Items.)
���۴�ýData on Race Relations in the Southern United States
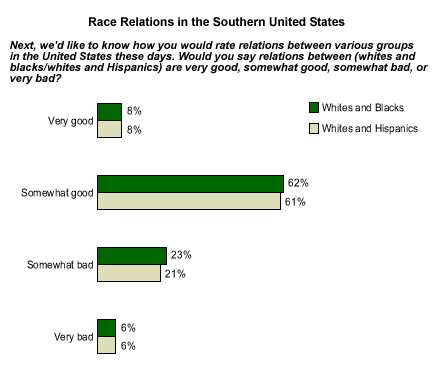
Interestingly, ���۴�ýPoll results** indicate that, Southern Americans' ratings of race relations are currently about average when compared with those in other parts of the country. Eight percent of Southerners believe relations between blacks and whites to be "very good," and 62% say they are "somewhat good." Close to a quarter (23%) feel that relations between whites and blacks are "somewhat bad" and 6% claim they are "very bad." These results are similar to the results for the country as a whole. Southerners' ratings of relations between whites and Hispanics are nearly identical to their ratings of white/black relations.

Southerners' opinions on discrimination in the workplace and public life are also quite similar to those in other regions. Forty-nine percent of Southerners believe that racial minorities have equal job opportunities as whites, while a similar number, 50%, thinks they do not.
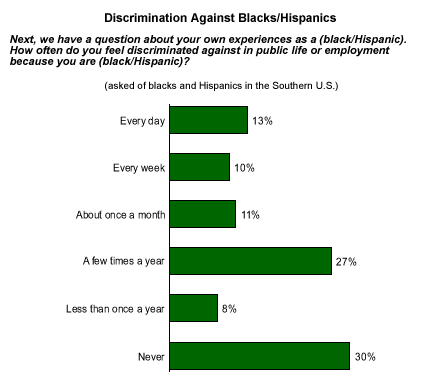
When blacks and Hispanics living in the South are asked if they experience discrimination in public life or employment, 13% say they face discrimination of this type every day. This figure is similar to that for the overall population. One in 10 say they face discrimination every week, 11% say "about once a month," 27% say "a few times a year" and 8% "less than once a year." Thirty percent say they never feel discriminated against because of their race, a figure similar to the national average.

Dissimilarity Indexes for Southern Metropolitan Areas
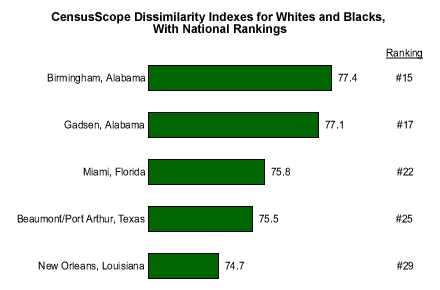
In the southern United States, 28 metropolitan areas fall into the top 100 "most segregated" areas, according to the CensusScope dissimilarity index rankings assessing residential patterns among whites and blacks. This compares to 34 metropolitan areas in the eastern United States and just four in the West. However, somewhat counterintuitively, none of the 14 most highly segregated urban areas is in the South.
The metropolitan area with the highest dissimilarity index for whites and blacks in the South (ranked 15th in the nation overall) is Birmingham, Ala. This city was referred to as ‘the nerve center' of the civil rights movement in the 1950s and 1960s, and it appears that racial integration is still somewhat out of reach. Birmingham's white/black dissimilarity index is 77.4, indicating that more than three-quarters of the white population would have to move to another neighborhood in order for whites and blacks to be evenly distributed across all neighborhoods in the area. Gadsen, Ala., has the second-highest dissimilarity index in the South (17th overall) at 77.1.
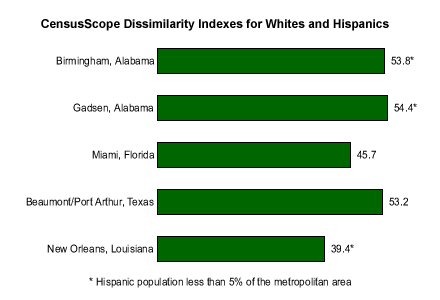
Turning to Florida, Miami's white/black dissimilarity index is 75.8 (22nd overall). Hispanics make up the majority of the population in this teeming metropolitan area, and the white/Hispanic dissimilarity index is substantially lower at 45.7.


Key Points
The South, a part of the country that one would not historically associate with racial harmony, does not actually fare as poorly as some other parts of the United States in terms of race and ethnic relations or racial or ethnic integration. While there is certainly room for improvement in opinions about race relations in this part of the country, Gallup's 2002 race relations data and dissimilarity index results suggest that the South may no longer trail the rest of the country when it comes to specific measures of residential integration and of attitudes toward black-white relations.
*Virginia, North Carolina, South Carolina, Georgia, Florida, Kentucky, Tennessee, Alabama, Mississippi, Arkansas, Louisiana, Oklahoma, Texas
**Results are based on telephone interviews with 1,360 national adults, aged 18 and older, conducted June 3-9, 2002, including oversamples of blacks and Hispanics that are weighted to reflect their proportions in the general population. For results based on the total sample of national adults, one can say with 95% confidence that the maximum margin of sampling error is ±3%.
