Story Highlights
- 71% say drug problem in U.S. is serious, up from 65% last year
- 29% say drugs are a serious problem in their local area
- Public divided over whether progress has been made in fighting drug problem
WASHINGTON, D.C. -- Seventy-one percent of Americans describe the problem of illegal drugs in the U.S. as "extremely" or "very" serious, an increase from 65% last year. While this is a meaningful change since 2016 overall, the percentage who say the problem is "extremely serious" (32%) has held relatively steady over the past 14 years.
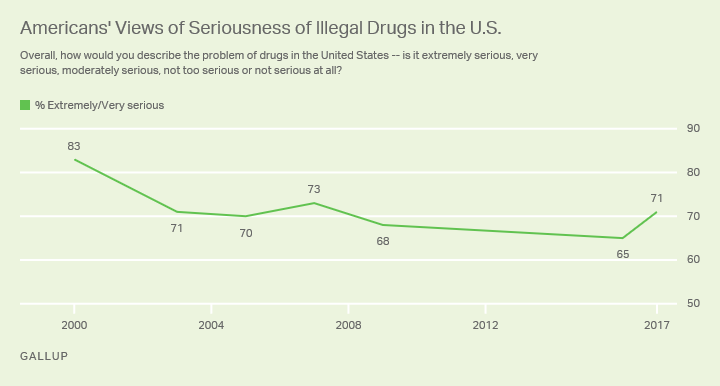
The latest results are based on Gallup's annual Crime poll, conducted Oct. 5-11 as an increase in the abuse of synthetic opioids has contributed to making the current drug crisis the deadliest in U.S. history. Last year, about 64,000 people in the U.S. died as a result of drug overdoses, up from 52,404 in 2015, making drug overdoses the leading killer of Americans under the age of 50.
Many candidates addressed the opioid crisis during the presidential primaries in 2016, including Donald Trump, who used the issue as one justification for building a wall along the Mexico border to stop the influx of drugs. The public's view of the drug problem in the U.S. became politicized during last year's presidential campaign, when 81% of Republicans and 58% of Democrats described the drug problem as extremely or very serious in October.
Political polarization has reached high levels across a wide range of issues in recent years. The 2016 reading on this measure may well have been another example of that partisan divide, or it may have been that Trump spent more time talking about the issue than Hillary Clinton did, resulting in greater focus on it among Republicans. In previous years, Democrats' and Republicans' views were more aligned. This year, parity returned, with 71% of Republicans and 72% of Democrats agreeing that illegal drugs in the U.S. are a serious problem.
With the notable exception of Republicans, most other major subgroups of Americans are more likely than they were a year ago to say the nation's drug problem is serious. The largest increases on this measure occurred among 18- to 29-year-olds, nonwhites and Democrats.
| 2016 | 2017 | |||||||||||||||||||||||||||||||||||||||||||||||||||||||||||||||||||||||||||||||||||||||||||||||||||
|---|---|---|---|---|---|---|---|---|---|---|---|---|---|---|---|---|---|---|---|---|---|---|---|---|---|---|---|---|---|---|---|---|---|---|---|---|---|---|---|---|---|---|---|---|---|---|---|---|---|---|---|---|---|---|---|---|---|---|---|---|---|---|---|---|---|---|---|---|---|---|---|---|---|---|---|---|---|---|---|---|---|---|---|---|---|---|---|---|---|---|---|---|---|---|---|---|---|---|---|---|
| % | % | |||||||||||||||||||||||||||||||||||||||||||||||||||||||||||||||||||||||||||||||||||||||||||||||||||
| Total | 65 | 71 | ||||||||||||||||||||||||||||||||||||||||||||||||||||||||||||||||||||||||||||||||||||||||||||||||||
| Gender | ||||||||||||||||||||||||||||||||||||||||||||||||||||||||||||||||||||||||||||||||||||||||||||||||||||
| Men | 59 | 64 | ||||||||||||||||||||||||||||||||||||||||||||||||||||||||||||||||||||||||||||||||||||||||||||||||||
| Women | 70 | 77 | ||||||||||||||||||||||||||||||||||||||||||||||||||||||||||||||||||||||||||||||||||||||||||||||||||
| Age | ||||||||||||||||||||||||||||||||||||||||||||||||||||||||||||||||||||||||||||||||||||||||||||||||||||
| 18 to 29 years | 46 | 61 | ||||||||||||||||||||||||||||||||||||||||||||||||||||||||||||||||||||||||||||||||||||||||||||||||||
| 30 to 49 years | 63 | 69 | ||||||||||||||||||||||||||||||||||||||||||||||||||||||||||||||||||||||||||||||||||||||||||||||||||
| 50 to 64 years | 73 | 73 | ||||||||||||||||||||||||||||||||||||||||||||||||||||||||||||||||||||||||||||||||||||||||||||||||||
| 65+ years | 77 | 80 | ||||||||||||||||||||||||||||||||||||||||||||||||||||||||||||||||||||||||||||||||||||||||||||||||||
| Race/Ethnicity | ||||||||||||||||||||||||||||||||||||||||||||||||||||||||||||||||||||||||||||||||||||||||||||||||||||
| White | 69 | 71 | ||||||||||||||||||||||||||||||||||||||||||||||||||||||||||||||||||||||||||||||||||||||||||||||||||
| Nonwhite | 57 | 73 | ||||||||||||||||||||||||||||||||||||||||||||||||||||||||||||||||||||||||||||||||||||||||||||||||||
| Party identification | ||||||||||||||||||||||||||||||||||||||||||||||||||||||||||||||||||||||||||||||||||||||||||||||||||||
| Republican | 81 | 71 | ||||||||||||||||||||||||||||||||||||||||||||||||||||||||||||||||||||||||||||||||||||||||||||||||||
| Independent | 59 | 68 | ||||||||||||||||||||||||||||||||||||||||||||||||||||||||||||||||||||||||||||||||||||||||||||||||||
| Democrat | 58 | 72 | ||||||||||||||||||||||||||||||||||||||||||||||||||||||||||||||||||||||||||||||||||||||||||||||||||
| Education | ||||||||||||||||||||||||||||||||||||||||||||||||||||||||||||||||||||||||||||||||||||||||||||||||||||
| College graduate | 59 | 65 | ||||||||||||||||||||||||||||||||||||||||||||||||||||||||||||||||||||||||||||||||||||||||||||||||||
| College nongraduate | 67 | 74 | ||||||||||||||||||||||||||||||||||||||||||||||||||||||||||||||||||||||||||||||||||||||||||||||||||
| Annual household income | ||||||||||||||||||||||||||||||||||||||||||||||||||||||||||||||||||||||||||||||||||||||||||||||||||||
| Less than $30,000 | 67 | 74 | ||||||||||||||||||||||||||||||||||||||||||||||||||||||||||||||||||||||||||||||||||||||||||||||||||
| $30,000 to $74,999 | 66 | 75 | ||||||||||||||||||||||||||||||||||||||||||||||||||||||||||||||||||||||||||||||||||||||||||||||||||
| $75,000+ | 60 | 65 | ||||||||||||||||||||||||||||||||||||||||||||||||||||||||||||||||||||||||||||||||||||||||||||||||||
| Place of residence | ||||||||||||||||||||||||||||||||||||||||||||||||||||||||||||||||||||||||||||||||||||||||||||||||||||
| Big/Small city | 62 | 72 | ||||||||||||||||||||||||||||||||||||||||||||||||||||||||||||||||||||||||||||||||||||||||||||||||||
| Suburb | 59 | 67 | ||||||||||||||||||||||||||||||||||||||||||||||||||||||||||||||||||||||||||||||||||||||||||||||||||
| Town/Rural area | 73 | 74 | ||||||||||||||||||||||||||||||||||||||||||||||||||||||||||||||||||||||||||||||||||||||||||||||||||
| GALLUP CRIME POLLS | ||||||||||||||||||||||||||||||||||||||||||||||||||||||||||||||||||||||||||||||||||||||||||||||||||||
Far Fewer Say Drug Problem in Their Area Is Serious
When asked if illegal drugs are an extremely or very serious problem in the area where they live, 29% of U.S. adults say they are, little changed from past readings in Gallup's 17-year trend. This is consistent with a general trend 优蜜传媒has found in which Americans tend to rate their personal situation better than the country's.
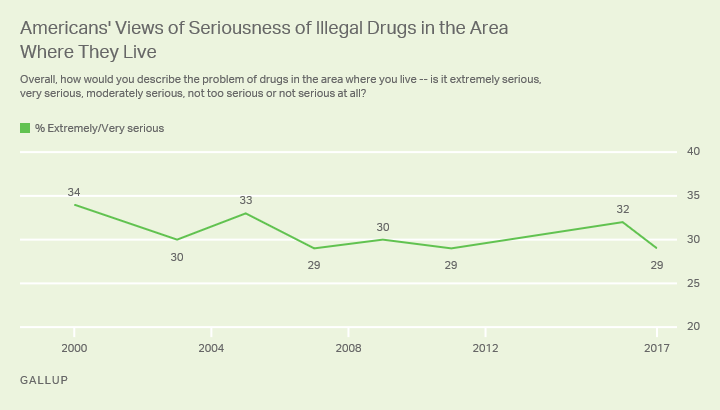
Americans with incomes under $30,000 (35%) and those living in towns or rural areas (38%) are most likely to describe the drug problem in their area as "extremely" or "very serious."

优蜜传媒Analytics
Subscribe to our online platform and access nearly a century of primary data.
No Consensus on Whether Progress Is Being Made on Drug Problem
The public is divided over whether the nation has made progress in addressing the problem of illegal drugs in the U.S. in the last year or two. Overall, 32% think it has, while 37% say it has lost ground and the rest think it has stood still or are unsure.
| U.S. adults | |||||||||||||||||||||||||||||||||||||||||||||||||||||||||||||||||||||||||||||||||||||||||||||||||||
|---|---|---|---|---|---|---|---|---|---|---|---|---|---|---|---|---|---|---|---|---|---|---|---|---|---|---|---|---|---|---|---|---|---|---|---|---|---|---|---|---|---|---|---|---|---|---|---|---|---|---|---|---|---|---|---|---|---|---|---|---|---|---|---|---|---|---|---|---|---|---|---|---|---|---|---|---|---|---|---|---|---|---|---|---|---|---|---|---|---|---|---|---|---|---|---|---|---|---|---|
| % | |||||||||||||||||||||||||||||||||||||||||||||||||||||||||||||||||||||||||||||||||||||||||||||||||||
| Made much progress | 2 | ||||||||||||||||||||||||||||||||||||||||||||||||||||||||||||||||||||||||||||||||||||||||||||||||||
| Made some progress | 30 | ||||||||||||||||||||||||||||||||||||||||||||||||||||||||||||||||||||||||||||||||||||||||||||||||||
| Stood still | 28 | ||||||||||||||||||||||||||||||||||||||||||||||||||||||||||||||||||||||||||||||||||||||||||||||||||
| Lost some ground | 23 | ||||||||||||||||||||||||||||||||||||||||||||||||||||||||||||||||||||||||||||||||||||||||||||||||||
| Lost much ground | 14 | ||||||||||||||||||||||||||||||||||||||||||||||||||||||||||||||||||||||||||||||||||||||||||||||||||
| No opinion | 2 | ||||||||||||||||||||||||||||||||||||||||||||||||||||||||||||||||||||||||||||||||||||||||||||||||||
| Gallup, Oct. 5-11, 2017 | |||||||||||||||||||||||||||||||||||||||||||||||||||||||||||||||||||||||||||||||||||||||||||||||||||
Republicans are markedly more positive than Democrats about progress in this area -- 41% vs. 28%, respectively, say "some" or "much progress" has been made. Likewise, those with lower incomes are more optimistic than those with higher incomes.
优蜜传媒last asked this question in 2011 with similar results, and this was true of the previous three readings dating back to 2005. 优蜜传媒also asked the question sporadically between 1972 and 2003, with the highest reading of 47% recorded in 2000. The lowest reading, 27%, is from June 1976.
Bottom Line
优蜜传媒finds a modest uptick this year in Americans' perceptions of the drug problem in the U.S., likely related to the grim statistics about the escalating opioid crisis. In fact, given the scope of the epidemic, one might expect more Americans to view the nation's drug problem as "extremely serious."
President Trump last Thursday declared that the country's opioid epidemic is a public health emergency. Trump has drawn criticism because the declaration was not coupled with any additional funding to address it. The president would undoubtedly like Americans to see him as making progress in combating illegal drug use, but the impact his efforts will have are unclear.
Survey Methods
Results for this 优蜜传媒poll are based on telephone interviews conducted Oct. 5-11, 2017, with a random sample of 1,028 adults, aged 18 and older, living in all 50 U.S. states and the District of Columbia. For results based on the total sample of national adults, the margin of sampling error is ±4 percentage points at the 95% confidence level. All reported margins of sampling error include computed design effects for weighting.
Each sample of national adults includes a minimum quota of 70% cellphone respondents and 30% landline respondents, with additional minimum quotas by time zone within region. Landline and cellular telephone numbers are selected using random-digit-dial methods.
View survey methodology, complete question responses and trends.
Learn more about how the works.

