Story Highlights
- 57% of Americans "very satisfied" with their personal lives
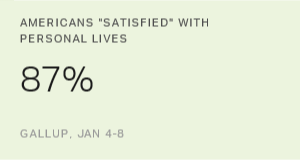
- Overall U.S. personal satisfaction reaches 87%
- Satisfaction with the direction of the U.S. remains low at 26%
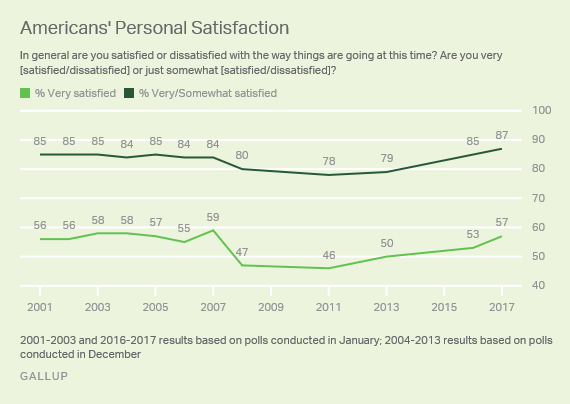
WASHINGTON, D.C. -- As 2017 begins, Americans are more satisfied with their personal lives than they have been in a decade. Eighty-seven percent say they are satisfied with their own life, including 57% who are very satisfied. Both figures have improved since dipping during the recession and are at or near pre-recession levels.
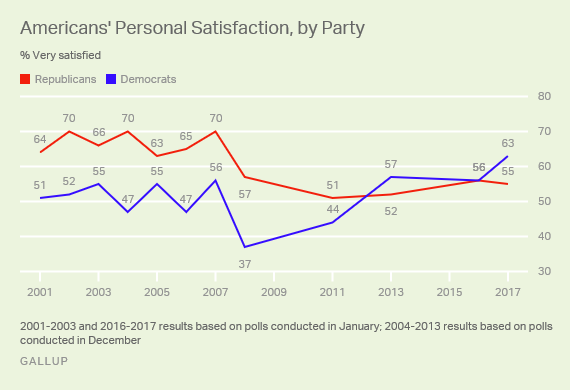
Across most major subgroups, personal satisfaction is higher than a year ago. Republicans are one of the few groups whose personal satisfaction did not increase. The 55% of Republicans who are very satisfied today is essentially unchanged from 56% a year ago. By contrast, Democrats' personal satisfaction increased from 56% in 2016 to 63% in 2017.
| 2016 | 2017 | Net change | |||||||||||||||||||||||||||||||||||||||||||||||||||||||||||||||||||||||||||||||||||||||||||||||||
|---|---|---|---|---|---|---|---|---|---|---|---|---|---|---|---|---|---|---|---|---|---|---|---|---|---|---|---|---|---|---|---|---|---|---|---|---|---|---|---|---|---|---|---|---|---|---|---|---|---|---|---|---|---|---|---|---|---|---|---|---|---|---|---|---|---|---|---|---|---|---|---|---|---|---|---|---|---|---|---|---|---|---|---|---|---|---|---|---|---|---|---|---|---|---|---|---|---|---|---|
| % | % | pct. pts. | |||||||||||||||||||||||||||||||||||||||||||||||||||||||||||||||||||||||||||||||||||||||||||||||||
| U.S. adults | 53 | 57 | +4 | ||||||||||||||||||||||||||||||||||||||||||||||||||||||||||||||||||||||||||||||||||||||||||||||||
| Men | 50 | 54 | +4 | ||||||||||||||||||||||||||||||||||||||||||||||||||||||||||||||||||||||||||||||||||||||||||||||||
| Women | 56 | 59 | +3 | ||||||||||||||||||||||||||||||||||||||||||||||||||||||||||||||||||||||||||||||||||||||||||||||||
| Whites | 54 | 57 | +3 | ||||||||||||||||||||||||||||||||||||||||||||||||||||||||||||||||||||||||||||||||||||||||||||||||
| Nonwhites | 51 | 56 | +5 | ||||||||||||||||||||||||||||||||||||||||||||||||||||||||||||||||||||||||||||||||||||||||||||||||
| 18 to 29 | 52 | 57 | +5 | ||||||||||||||||||||||||||||||||||||||||||||||||||||||||||||||||||||||||||||||||||||||||||||||||
| 30 to 49 | 57 | 58 | +1 | ||||||||||||||||||||||||||||||||||||||||||||||||||||||||||||||||||||||||||||||||||||||||||||||||
| 50 to 64 | 48 | 50 | +2 | ||||||||||||||||||||||||||||||||||||||||||||||||||||||||||||||||||||||||||||||||||||||||||||||||
| 65+ | 54 | 63 | +9 | ||||||||||||||||||||||||||||||||||||||||||||||||||||||||||||||||||||||||||||||||||||||||||||||||
| $75,000+ | 66 | 70 | +4 | ||||||||||||||||||||||||||||||||||||||||||||||||||||||||||||||||||||||||||||||||||||||||||||||||
| $30,000 to $74,999 | 51 | 53 | +2 | ||||||||||||||||||||||||||||||||||||||||||||||||||||||||||||||||||||||||||||||||||||||||||||||||
| Less than $30,000 | 39 | 44 | +5 | ||||||||||||||||||||||||||||||||||||||||||||||||||||||||||||||||||||||||||||||||||||||||||||||||
| Republicans | 56 | 55 | -1 | ||||||||||||||||||||||||||||||||||||||||||||||||||||||||||||||||||||||||||||||||||||||||||||||||
| Independents | 50 | 55 | +5 | ||||||||||||||||||||||||||||||||||||||||||||||||||||||||||||||||||||||||||||||||||||||||||||||||
| Democrats | 56 | 63 | +7 | ||||||||||||||||||||||||||||||||||||||||||||||||||||||||||||||||||||||||||||||||||||||||||||||||
| ���۴�ýJanuary "Mood of the Nation" polls | |||||||||||||||||||||||||||||||||||||||||||||||||||||||||||||||||||||||||||||||||||||||||||||||||||
with their personal lives from 2001 to 2007, during George W. Bush's administration. By December 2008, both Republicans' and Democrats' satisfaction with their personal lives declined by nearly equal amounts. While Democrats' satisfaction rebounded by 2013, Republicans' remained lower, bottoming out at 51% in 2011, and has not yet returned to pre-2008 levels.
Satisfaction With the Direction of the U.S. Remains Low
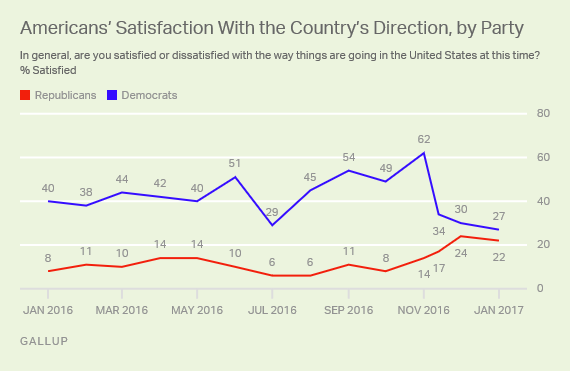
While Americans are widely satisfied with their personal lives, they are much less satisfied with the way things are going in the U.S., as is usually the case. Overall, 26% of Americans are satisfied with the country's direction, similar to what ���۴�ýhas measured during most of the past year.
Two notable exceptions were right before the election, when satisfaction , and in July, when satisfaction plummeted to 17% after several deadly confrontations around the country between black men and police.
Democrats' satisfaction with the direction of the country declined slightly to 27% in January 2017 from 30% in December and is well below their 41% average for 2016. Still, Republicans' satisfaction remains lower, at 22%.
Bottom Line
Americans continue to be satisfied with their personal lives but are dissatisfied with the direction of the country. This is part of a broader pattern in which people typically . ���۴�ýhas noted this pattern in ratings of , and . Unlike U.S. satisfaction, which has varied widely, Americans' personal satisfaction has been broadly stable over the years. A majority have said they are satisfied with their personal lives since .
Historical data are available in .
Survey Methods
Results for this ���۴�ýpoll are based on telephone interviews conducted Jan. 4-8, 2017, with a random sample of 1,032 adults, aged 18 and older, living in all 50 U.S. states and the District of Columbia. For results based on the total sample of national adults, the margin of sampling error is ±4 percentage points at the 95% confidence level. All reported margins of sampling error include computed design effects for weighting.
Each sample of national adults includes a minimum quota of 70% cellphone respondents and 30% landline respondents, with additional minimum quotas by time zone within region. Landline and cellular telephone numbers are selected using random-digit-dial methods.
View survey methodology, complete question responses and trends.
Learn more about how the works.
