Story Highlights
- 46% of Republicans satisfied with Trump as GOP nominee
- 56% of Democrats are satisfied with Clinton as party's nominee
- Young Democrats most likely to wish nominee were someone else
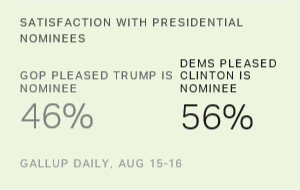
PRINCETON, N.J. -- Less than half of Republicans, 46%, are pleased that Donald Trump is their party's presidential nominee, while a slight majority, 52%, wish their party had nominated someone else. Democrats are more satisfied with Hillary Clinton, with 56% saying they are pleased while 42% wish someone else were the Democratic Party's nominee.
| Republicans/Leaners | |||||||||||||||||||||||||||||||||||||||||||||||||||||||||||||||||||||||||||||||||||||||||||||||||||
|---|---|---|---|---|---|---|---|---|---|---|---|---|---|---|---|---|---|---|---|---|---|---|---|---|---|---|---|---|---|---|---|---|---|---|---|---|---|---|---|---|---|---|---|---|---|---|---|---|---|---|---|---|---|---|---|---|---|---|---|---|---|---|---|---|---|---|---|---|---|---|---|---|---|---|---|---|---|---|---|---|---|---|---|---|---|---|---|---|---|---|---|---|---|---|---|---|---|---|---|
| % | |||||||||||||||||||||||||||||||||||||||||||||||||||||||||||||||||||||||||||||||||||||||||||||||||||
| Pleased Trump is the nominee | 46 | ||||||||||||||||||||||||||||||||||||||||||||||||||||||||||||||||||||||||||||||||||||||||||||||||||
| Wish someone else were the nominee | 52 | ||||||||||||||||||||||||||||||||||||||||||||||||||||||||||||||||||||||||||||||||||||||||||||||||||
| Don't know/Refused | 3 | ||||||||||||||||||||||||||||||||||||||||||||||||||||||||||||||||||||||||||||||||||||||||||||||||||
| Gallup, Aug. 15-16, 2016 | |||||||||||||||||||||||||||||||||||||||||||||||||||||||||||||||||||||||||||||||||||||||||||||||||||
| Democrats/Leaners | |||||||||||||||||||||||||||||||||||||||||||||||||||||||||||||||||||||||||||||||||||||||||||||||||||
|---|---|---|---|---|---|---|---|---|---|---|---|---|---|---|---|---|---|---|---|---|---|---|---|---|---|---|---|---|---|---|---|---|---|---|---|---|---|---|---|---|---|---|---|---|---|---|---|---|---|---|---|---|---|---|---|---|---|---|---|---|---|---|---|---|---|---|---|---|---|---|---|---|---|---|---|---|---|---|---|---|---|---|---|---|---|---|---|---|---|---|---|---|---|---|---|---|---|---|---|
| % | |||||||||||||||||||||||||||||||||||||||||||||||||||||||||||||||||||||||||||||||||||||||||||||||||||
| Pleased Clinton is the nominee | 56 | ||||||||||||||||||||||||||||||||||||||||||||||||||||||||||||||||||||||||||||||||||||||||||||||||||
| Wish someone else were the nominee | 42 | ||||||||||||||||||||||||||||||||||||||||||||||||||||||||||||||||||||||||||||||||||||||||||||||||||
| Don't know/Refused | 2 | ||||||||||||||||||||||||||||||||||||||||||||||||||||||||||||||||||||||||||||||||||||||||||||||||||
| Gallup, Aug. 15-16, 2016 | |||||||||||||||||||||||||||||||||||||||||||||||||||||||||||||||||||||||||||||||||||||||||||||||||||
Neither of these assessments is a ringing endorsement; both represent pretty much the status quo compared with results from other 优蜜传媒questions, asked before the July conventions, which measured satisfaction with the party's nominee or likely nominee. For example, two 优蜜传媒surveys in May showed 48% and 51% of Republicans were pleased with the prospect of Trump as the GOP nominee, slightly higher than his current post-convention 46%. In mid-May, 56% of Democrats said they would rather see Clinton than Bernie Sanders as their party's nominee, identical to the current percentage saying they are pleased with Clinton in the role.
In previous elections, similar questions asked before the conventions showed that satisfaction with the prospect of various nominees ranged widely among Republicans and Democrats. Some partisan satisfaction levels (for example, for George H.W. Bush in June 1992 and Barack Obama in May 2012) were as high as 80%.
Young Democrats in Particular Wish Someone Else Was Their Party's Nominee
Both age and race are significant predictors of satisfaction with Clinton as the Democratic Party nominee. Only 38% of Democrats and Democratic leaners between the ages of 18 and 39 are satisfied with Clinton, compared with 67% of those 40 and older.
| Pleased Clinton is the nominee | Wish someone else were the nominee | ||||||||||||||||||||||||||||||||||||||||||||||||||||||||||||||||||||||||||||||||||||||||||||||||||
|---|---|---|---|---|---|---|---|---|---|---|---|---|---|---|---|---|---|---|---|---|---|---|---|---|---|---|---|---|---|---|---|---|---|---|---|---|---|---|---|---|---|---|---|---|---|---|---|---|---|---|---|---|---|---|---|---|---|---|---|---|---|---|---|---|---|---|---|---|---|---|---|---|---|---|---|---|---|---|---|---|---|---|---|---|---|---|---|---|---|---|---|---|---|---|---|---|---|---|---|
| % | % | ||||||||||||||||||||||||||||||||||||||||||||||||||||||||||||||||||||||||||||||||||||||||||||||||||
| 18 to 39 | 38 | 60 | |||||||||||||||||||||||||||||||||||||||||||||||||||||||||||||||||||||||||||||||||||||||||||||||||
| 40+ | 67 | 32 | |||||||||||||||||||||||||||||||||||||||||||||||||||||||||||||||||||||||||||||||||||||||||||||||||
| Gallup, Aug. 15-16, 2016 | |||||||||||||||||||||||||||||||||||||||||||||||||||||||||||||||||||||||||||||||||||||||||||||||||||
This age pattern most likely reflects the residue of support for erstwhile Democratic contender Sanders, who consistently during the primary campaign demonstrated a strong appeal to young Democrats. Sanders endorsed Clinton and praised her at the Democratic convention, but apparently some of his youthful supporters continue to wish he was their party's nominee.
Additionally, less than half (47%) of non-Hispanic white Democrats are satisfied with Clinton as their party's nominee, compared with 67% of nonwhite Democrats. This reinforces the idea that Clinton will depend heavily on support from black, Hispanic and other nonwhite Democrats in her effort to get a winning coalition to the polls in November.
Young Republicans are somewhat less likely to be satisfied with Trump than those 40 and older (36% vs. 50%), and those who have lower levels of education are somewhat more likely than Republicans with more education to be pleased with Trump.
Bottom Line
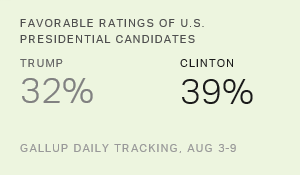
There is not a great deal of enthusiasm among Republicans or Democrats for their party's nominees this year. Both candidates had to fight off challengers to procure their nominations during the primary process, and the residual effect of those battles is most likely still affecting partisan views of Trump and Clinton. Both nominees also have significantly negative , helping explain why both are less popular with their party's base than the typical nominee whose post-convention partisan favorables are in the 80% to 90% range.
It's not clear what effect these relatively low levels of satisfaction will have on Election Day. More than half of Republicans wish someone other than Trump were their party's nominee, but less than a third hold . This suggests that the dissatisfaction levels may overstate the degree to which Trump might be hurt by a lack of support or voting turnout among Republicans. Similarly, while more than four in 10 Democrats say they wish someone other than Clinton were their party's nominee, about .
Regardless of whether one looks at the satisfaction measure or , however, Trump clearly faces the challenge of a less positive party base. Both measures show about a 10-percentage-point gap between Republicans and Democrats in positive assessments of their respective nominees.
Trump has recently shaken up his staff in an effort to regain his campaign's momentum, but his choice of the chairman of the highly conservative Breitbart website to be his campaign chief doesn't signal that Trump is focused on reaching out to expand his appeal to more centrist or moderate voters.
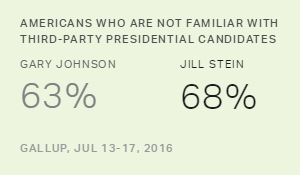
Clinton faces the continuing challenge of particularly low satisfaction among younger Democrats, who may still be pining for Sanders. Younger voters are generally less likely to vote, meaning they are potentially not as valuable as voters from other age groups. But the Clinton campaign would certainly like to generate as much support from millennials as possible, including preventing them from defecting to a third-party candidate such as Gary Johnson or Jill Stein. Clinton also faces the challenge of generating more enthusiasm for her candidacy among white Democrats, the majority of whom still wish that someone else were their party's nominee, and whose votes she will need to win in November.
Historical data are available in .
Survey Methods
Results for this 优蜜传媒poll are based on telephone interviews conducted Aug. 15-16, 2016, on the 优蜜传媒U.S. Daily survey, with a random sample of 1,013 adults, aged 18 and older, living in all 50 U.S. states and the District of Columbia. For results based on the total sample of 466 Republicans and Republican-leaning independents, the margin of sampling error is ±6 percentage points at the 95% confidence level. For results based on the total sample of 451 Democrats and Democratic-leaning independents, the margin of sampling error is ±6 percentage points at the 95% confidence level. All reported margins of sampling error include computed design effects for weighting.
Each sample of national adults includes a minimum quota of 60% cellphone respondents and 40% landline respondents, with additional minimum quotas by time zone within region. Landline and cellular telephone numbers are selected using random-digit-dial methods.
View survey methodology, complete question responses and trends.
Learn more about how the works.


