Story Highlights
- Democrats led 45% to 43% in partisanship in third quarter
- Two-point edge is similar to strong Republican midterm years
- Democrats need larger edge to overcome usual turnout deficit
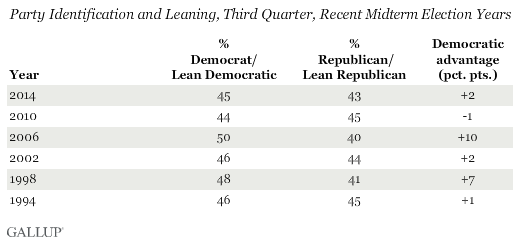
WASHINGTON, D.C. -- Americans' party preferences during the third quarter of a midterm election year give a good indication of which party will perform better in that year's election. Democrats' narrow two-percentage-point advantage in party affiliation this year -- 45% to 43% -- shares a greater similarity with strong Republican midterm years, such as 1994, 2002 and 2010, than with the advantage held in better Democratic years like 1998 and 2006.

Democrats in party affiliation among the national adult population -- Republicans have held a slight numerical advantage in only three years since 1993. But since Republicans and Republican leaners typically than Democrats and Democratic-leaning independents, the voting electorate will usually be much less Democratic than the larger adult population. Thus, if Democrats start out with only a slim advantage among all adults, the voting electorate may very well end up being more Republican than Democratic.
Although party affiliation and vote choice are not the same thing, they are strongly related. Typically upwards of nine in 10 voters who identify or lean with a party will vote for that party's candidate for Congress, emphasizing the importance of voter turnout among the major party groups.
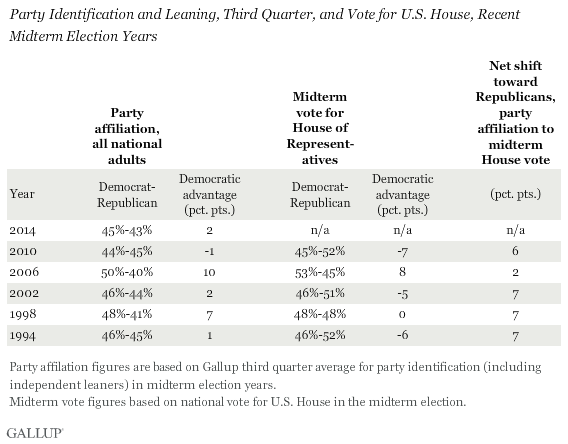
The accompanying table shows how the national vote for Congress compares with the initial party leanings of the adult population. This gives a sense of the impact of turnout and how Republicans can easily overcome a slight deficit in partisanship with superior voter turnout.

In each of the past five midterm elections, Republicans appeared to have stronger turnout, based on how voters nationwide cast their votes for the House of Representatives versus the party affiliation among the larger national adult population. The differences in national party affiliation versus the national vote by party show a shift in the Republican direction that ranges between two and seven percentage points in these elections. The smallest difference occurred in 2006, when Democrats had a 10-point advantage in partisanship among all adults and a slightly smaller eight-point advantage in the voting electorate's candidate choices.
In the other four elections, the Republican turnout advantage was large enough to wipe out the Democratic advantage in partisanship, including in 1998 when Democrats gained seats in the House of Representatives but the Republicans maintained their majority.
With Republicans currently trailing by two points in national party affiliation, if turnout patterns by party in this year's election are similar to the past, that would suggest Republican House candidates would get more votes nationwide than Democrats. Unless turnout is unusually heavy for Democrats -- something suggest is not likely to be the case -- Republicans will hold onto their majority in the House of Representatives.
Implications
Democrats have big challenges in convincing voters to support their party in this year's midterm congressional elections with and Americans' feelings of . In addition to that, the Democrats face some structural disadvantages, including their typically lower voter turnout than Republicans, but also a congressional seat map that appears tilted in Republicans' favor.
In 2012 -- the first year in which congressional candidates competed in newly drawn districts after the 2010 census -- Democrats received a majority of the two-party votes for the House of Representatives, but not a majority of seats. In fact, Democrats netted 46% of House seats despite winning 51% of the popular vote for the House. As a result, not only must Democrats outpoll Republicans this fall, they must do so by a healthy margin to regain the majority in the House.
With little seeming to be in their favor, the real drama in the 2014 midterms is likely not to be if Nov. 4 will be a difficult day for Democrats, but just how difficult it will be.
Survey Methods
Results for this 优蜜传媒poll are based on combined telephone interviews conducted July-September 2014, with a random sample of 4,314 adults, aged 18 and older, living in all 50 U.S. states and the District of Columbia.
For results based on the total sample of national adults, the margin of sampling error is 卤1 percentage points at the 95% confidence level.
Each sample of national adults includes a minimum quota of 50% cellphone respondents and 50% landline respondents, with additional minimum quotas by time zone within region. Landline and cellular telephone numbers are selected using random-digit-dial methods.
Learn more about the works.

