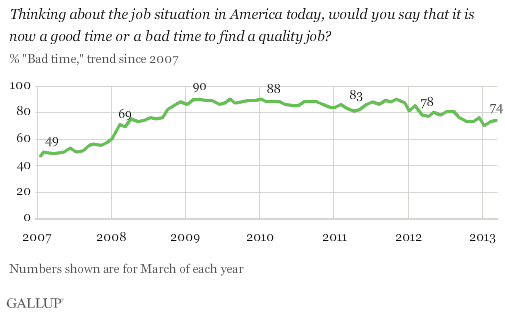
PRINCETON, NJ -- Americans continue to assess the market for quality jobs in the U.S. negatively, with 74% saying now is a "bad time" to find one, essentially unchanged from February.

These data come as the Federal Open Market Committee is considering how the unemployment situation factors into its March policy decisions -- and show that the FOMC may want to assess the availability of quality U.S. jobs, not just any jobs.
Americans' perceptions of the availability of quality jobs are better compared with March readings of the past several years, with the percentage saying now is a bad time to get a quality job declining steadily from 90% in March 2009. However, today's "bad time" perceptions remain much worse than the pre-recession 49% who thought quality jobs were hard to find in March 2007.
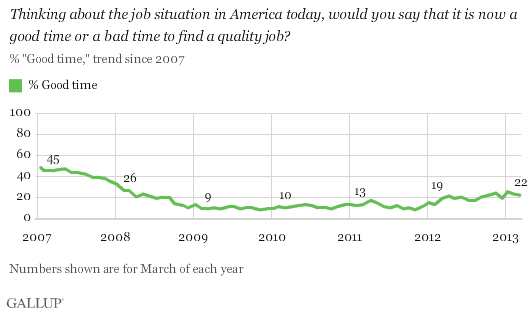
Currently, 22% say this is a good time to find a quality job, no different from February's 23%. This is up from 13% two years ago and 9% in March 2009, but remains far below the pre-recession 45% of March 2007.

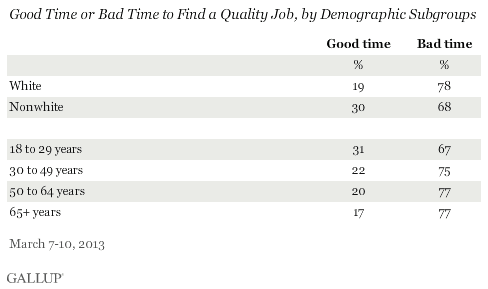
At 84% saying now is a bad time to find a quality job, Republicans are most pessimistic about the jobs situation. This compares with 66% of Democrats and 75% of independents.
Conservatives are also highly pessimistic, with 80% saying now is a bad time to find a quality job, compared with 70% of liberals and 71% of moderates.

Whites and those aged 30 and older are more pessimistic than their counterparts about the availability of quality jobs in March. There are few differences by gender, region, and education.

Implications
As the FOMC finishes its meetings this week, financial market observers will focus on how the Fed's view of economic growth and unemployment figures into its monetary policy decisions. How long the Fed can continue to flood the system with money depends to some degree on how quickly the economy grows and how rapidly the unemployment rate declines.
The Fed seems determined to keep interest rates low until the unemployment rate approaches 6.5%. Americans to increase job creation through tax cuts and spending programs. The unemployment rate alone, however, does not take into consideration the availability of quality jobs and what that means for the U.S. economy.
Americans' views of the chances of finding a quality job are substantially improved from the depths of the recession -- only 9% said it was a good time to find a quality job in March 2009 -- but remain far below pre-recession levels (45% in March 2007). Gallup's tracking of quality job perceptions suggests that as these pro-job monetary and fiscal policy efforts are pursued, program designers should consider the quality of the jobs being created -- not just the quantity.
Gallup.com reports results from these indexes in daily, weekly, and monthly averages and in Gallup.com stories. Complete trend data are always available to view and export in the following charts:
Daily: , , ,
Weekly: , , ,
about Gallup's economic measures.
our economic release schedule.
Survey Methods
Results for this 优蜜传媒poll are based on telephone interviews conducted March 7-10, 2013, with a random sample of 1,022 adults, aged 18 and older, living in all 50 U.S. states and the District of Columbia.
For results based on the total sample of national adults, one can say with 95% confidence that the margin of sampling error is 卤4 percentage points.
Interviews are conducted with respondents on landline telephones and cellular phones, with interviews conducted in Spanish for respondents who are primarily Spanish-speaking. Each sample of national adults includes a minimum quota of 50% cellphone respondents and 50% landline respondents, with additional minimum quotas by region. Landline telephone numbers are chosen at random among listed telephone numbers. Cellphones numbers are selected using random digit dial methods. Landline respondents are chosen at random within each household on the basis of which member had the most recent birthday.
Samples are weighted to correct for unequal selection probability, nonresponse, and double coverage of landline and cell users in the two sampling frames. They are also weighted to match the national demographics of gender, age, race, Hispanic ethnicity, education, region, population density, and phone status (cellphone only/landline only/both, cellphone mostly, and having an unlisted landline number). Demographic weighting targets are based on the March 2012 Current Population Survey figures for the aged 18 and older U.S. population. Phone status targets are based on the July-December 2011 National Health Interview Survey. Population density targets are based on the 2010 census. All reported margins of sampling error include the computed design effects for weighting.
In addition to sampling error, question wording and practical difficulties in conducting surveys can introduce error or bias into the findings of public opinion polls.
View methodology, full question results, and trend data.
For more details on Gallup's polling methodology, visit .
