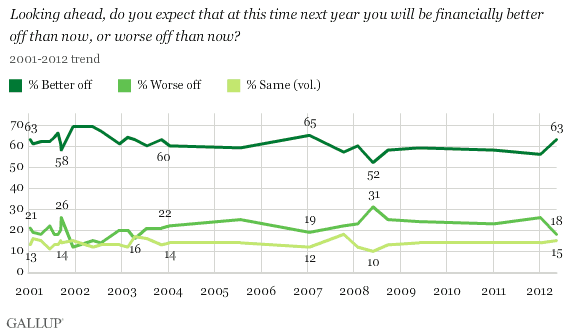
PRINCETON, NJ -- Americans' expectations for their personal financial situations have recovered from the low point of four years ago, with 63% now saying they expect to be better off a year from now, up from 52% in late May/early June 2008. The 18% who say they will be financially worse off in a year is by one percentage point the lowest since 2003.

When George W. Bush took office in January 2001, financial expectations were about where they are today -- 63% said they would be better off in a year, and 21% said they would be worse off. Americans became a little more pessimistic toward the end of the last decade, and by late May/early June 2008, 52% said they would be better off, while 31% said they would be worse off.
The current reading of 63% "better off" compares with 60% in January 2004, 66% in March 1996, and 51% in March 1992 -- all years in which incumbent presidents were seeking re-election. In 2004 and 1996, incumbent presidents were re-elected, while the incumbent in 1992 -- George H.W. Bush -- was defeated. Thus, on this one measure, President Obama's situation looks somewhat more positive than is indicated by .
ÆéûÜǨû§has been asking this question since 1977. Americans have always been more likely to say they will be better off financially in a year than to say they will be worse off.
The high point for economic optimism in Gallup's history of asking this question came in March 1998, when 71% of Americans said they would be better off in a year and 9% said worse off. The lowest level of optimism was in June 1979, when 33% said they would be better off and 27% said worse off, with the rest saying their situation would stay the same or not giving a response.
Americans Less Positive When Assessing Current Financial Situation
Americans are generally less positive about whether their current economic situation has improved over the past year. Currently, 37% say they are better off than a year ago, 42% say worse off, and 20% volunteer that they are in the same place. The percentage saying they are now better off is up from earlier this year, and from measures taken since 2008, but is still considerably lower than at other points in the last decade, including a recent high of 50% in January 2007. When George W. Bush took office in January 2001, 49% said they were "better off" than a year before, significantly higher than the current reading.
The current 37% who say they are better off now than a year ago is lower than the 49% in March 1996, the year Bill Clinton successfully sought re-election. It is slightly higher than the 34% in February 1992, when incumbent George H.W. Bush ran and lost. ÆéûÜǨû§did not ask this question in 2004 prior to George W. Bush's re-election bid. The historical context provided by this "current conditions" question, then, looks slightly less auspicious for Obama than the expectations question.

The long-term high point on this measure came in January 1999, when 58% said they were better off financially than the year before. The low point in Gallup's history of asking the question since 1976 was May 2009, when 23% of Americans said they were better off.
Implications
Americans optimistically and consistently say their financial situations will improve in the year ahead rather than say they will deteriorate, and often by significant margins. Even at the low point of the recent recession in 2008, more than half of Americans maintained their belief that they would be better off in a year.
Thus, the fact that 63% of Americans think their financial situations will be better in one year is not unusual by historical standards. But it is modestly more positive than it was at the low point of 2008, which suggests that the average American appears to see some light at the end of the financial tunnel. At the same time, Americans are not as sanguine when asked to assess their current situation compared with a year ago -- although that measure too is higher than at any point since 2007.
Americans in general tend to be more positive when asked to opine about personal or local situations than they are when asked about national conditions. It is not surprising as a result to find that their assessments of the direction of their personal finances contrast with the more negative view Americans have of the national economy's direction. Last week, -- although this too is improved from recent months.
These perceptions of the economy's direction -- both nationally and personally -- are related to Americans' predisposition to re-elect an incumbent president. The modest uptick in Americans' views of their financial future thus may be a positive finding for President Obama's re-election campaign. The more negative status of the "current conditions" question, on the other hand, may provide a more cautionary note.
Survey Methods
Results for this USA Today/ÆéûÜǨû§poll are based on telephone interviews conducted May 10-13, 2012, with a random sample of 1,012 adults, aged 18 and older, living in all 50 U.S. states and the District of Columbia.
For results based on the total sample of national adults, one can say with 95% confidence that the maximum margin of sampling error is ôÝ4 percentage points.
Interviews are conducted with respondents on landline telephones and cellular phones, with interviews conducted in Spanish for respondents who are primarily Spanish-speaking. Each sample includes a minimum quota of 400 cell phone respondents and 600 landline respondents per 1,000 national adults, with additional minimum quotas among landline respondents by region. Landline telephone numbers are chosen at random among listed telephone numbers. Cell phone numbers are selected using random-digit-dial methods. Landline respondents are chosen at random within each household on the basis of which member had the most recent birthday.
Samples are weighted by gender, age, race, Hispanic ethnicity, education, region, adults in the household, and phone status (cell phone only/landline only/both, cell phone mostly, and having an unlisted landline number). Demographic weighting targets are based on the March 2011 Current Population Survey figures for the aged 18 and older non-institutionalized population living in U.S. telephone households. All reported margins of sampling error include the computed design effects for weighting and sample design.
In addition to sampling error, question wording and practical difficulties in conducting surveys can introduce error or bias into the findings of public opinion polls.
View methodology, full question results, and trend data.
For more details on Gallup's polling methodology, visit .
