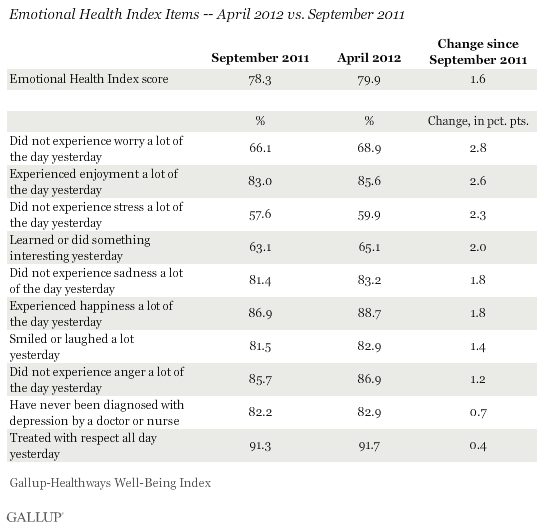
WASHINGTON, D.C. -- Americans' emotional heath improved in April and, by a slight margin, is now higher than it has been in any month since ÆéûÜǨû§and Healthways started tracking it in January 2008. Gallup's U.S. Emotional Health Index score was 79.9 last month, slightly above the previous high of 79.8 recorded in March 2008 and May 2010. Americans' emotional health has generally been improving since September, when it dropped to its lowest level in more than three years (78.3).

These findings are based on approximately 30,000 interviews with American adults conducted each month from January 2008 through April 2012 as a part of the Gallup-Healthways Well-Being Index. The Emotional Health Index score is based on based on Americans' self-reports of positive and negative daily emotions, as well as self-reported clinical diagnoses of depression. Specifically, Americans are asked whether they felt or did "a lot of" each of the following the day before the survey: smiling/laughing, learning/doing something interesting, being treated with respect, enjoyment, happiness, worry, sadness, anger, and stress.
While the Emotional Health Index score has stayed in a narrow range between 77.5 and 79.9 over the past 4 ô¥ years, it now surpasses the levels ÆéûÜǨû§measured before the September 2008 financial crisis. The previous high of 79.8 came in March 2008 and May 2010, and the low of 77.5 came in December 2008.
Americans' emotional health had been improving in 2011, reaching a one-year high in May (79.6), but then steadily sank in the summer and fall, at the same time that and as Americans became more pessimistic about their .
More Americans Experiencing Enjoyment, Fewer Reporting Worry and Stress
Americans score better on all 10 of the Emotional Health Index measures in April than they did at the low point in September. The percentage of Americans who did not "worry a lot of the day yesterday" has improved the most. In April, 68.9% of Americans said they did not experience worry a lot of the previous day, up from 66.1% in September. Similarly, the percentage of Americans who said they did not experience stress was 59.9% in April, up from 57.6% in September.
Self-reported "enjoyment" has also increased. The percentage who said they experienced enjoyment a lot of the previous day rose to 85.6% in April, up from the three-year low of 83.0% in September.

Bottom Line
Americans' emotional health has generally been improving since September, reaching a four-year high of 79.9 in April. Americans are now less worried and stressed, and report having more enjoyment. These emotional changes coincide with and . Thus, whether Americans' emotional health continues to improve may depend on what happens with the economic climate in the coming months.
About the Gallup-Healthways Well-Being Index
The Gallup-Healthways Well-Being Index tracks well-being in the U.S., U.K., and Germany and provides best-in-class solutions for a healthier world. To learn more, please visit .
Survey Methods
Results are based on telephone interviews conducted as part of the Gallup-Healthways Well-Being Index survey with a random sample of approximately 30,000 adults, aged 18 and older, living in all 50 U.S. states and the District of Columbia, selected using random-digit-dial sampling. The results for March reflect 28,215 interviews conducted April 1-30, 2012.
For results based on the total sample of national adults, one can say with 95% confidence that the maximum margin of sampling error is ôÝ0.6 percentage points.
Interviews are conducted with respondents on landline telephones and cellular phones, with interviews conducted in Spanish for respondents who are primarily Spanish-speaking. Each sample includes a minimum quota of 400 cell phone respondents and 600 landline respondents per 1,000 national adults, with additional minimum quotas among landline respondents by region. Landline telephone numbers are chosen at random among listed telephone numbers. Cell phone numbers are selected using random-digit-dial methods. Landline respondents are chosen at random within each household on the basis of which member had the most recent birthday.
Samples are weighted by gender, age, race, Hispanic ethnicity, education, region, adults in the household, and phone status (cell phone only/landline only/both, cell phone mostly, and having an unlisted landline number). Demographic weighting targets are based on the March 2010 Current Population Survey figures for the aged 18 and older non-institutionalized population living in U.S. telephone households. All reported margins of sampling error include the computed design effects for weighting and sample design.
In addition to sampling error, question wording and practical difficulties in conducting surveys can introduce error or bias into the findings of public opinion polls.
For more details on Gallup's polling methodology, visit .
