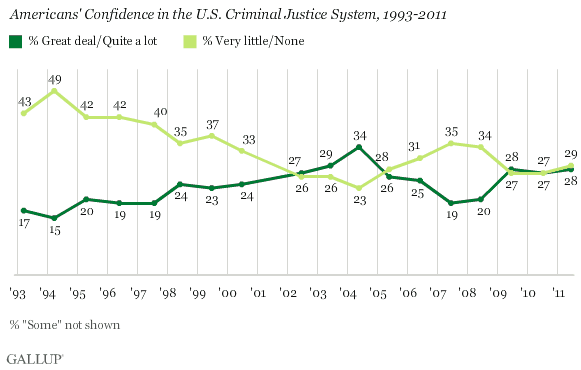
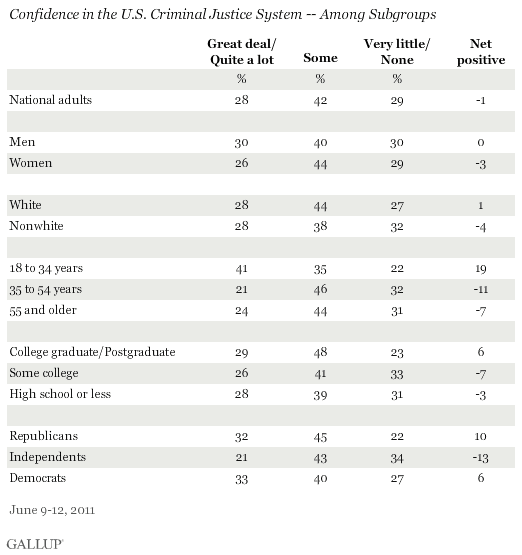
PRINCETON, NJ -- Prior to the recent verdict in the Casey Anthony trial, Americans had middling confidence in the nation's criminal justice system. Twenty-eight percent interviewed June 9-12 said they had a great deal or quite a lot of confidence in the system, 42% had some, and 29% very little or none.

The criminal justice system tied newspapers for 9th place on , out of 16 institutions rated. The 28% expressing high confidence falls almost halfway between confidence in the police (56%) and Congress (12%), although it is well below the exceptionally high levels seen for the military (78%) and small business (64%).
Confidence in Criminal Justice System on High End of Trend
While 28% high confidence is not a stellar rating for the nation's justice system, it is among the more positive ratings of it ���۴�ýhas recorded since first including it on the annual Confidence in Institutions measure in 1993.

From 1993 through 1997, more than twice as many Americans expressed little or no confidence as expressed high confidence in the criminal justice system. This coincided with negative publicity for the police and the justice system stemming from the 1991 Rodney King beating and the acquittal of four officers in that case in 1992; broader criticism of racial profiling during this period; and, subsequently, Americans' mostly negative reactions to the 1995 "not guilty" verdict in the .
Public attitudes toward the criminal justice system improved in 1998 and continued to do so through 2004, when high confidence peaked at 34%. Confidence then descended from 2005 through 2007 -- apparently part of associated with deteriorating satisfaction with President George W. Bush and the direction of the country. It , coinciding with improved ratings of government under President Barack Obama. Since then, as many Americans have had high confidence as low confidence in the system.
Slight Differences in Confidence by Age, Race, Education, and Partisanship
���۴�ýfinds relatively slight differences among most U.S. subgroups' views toward the criminal justice system, as the plurality of almost all groups express "some" confidence in it. However, young adults are substantially more likely to have high confidence in the system than low confidence, distinguishing them from older adults. Additionally, Republicans and Democrats are more likely to have high than low confidence, while independents tilt toward low confidence.

Bottom Line
Americans' confidence in the U.S. criminal justice system is muted, with as many Americans expressing low confidence as high confidence. This puts the system in about the middle of the various institutions rated this year. However, the 28% now expressing a great deal or quite a lot of confidence is on the high end of the historical range.
Gallup's trends also suggest that specific matters pertaining to the police and high-profile legal cases may have influenced Americans' views toward the criminal justice system in the past. Given that, the "not guilty" verdict in the Anthony trial theoretically could do the same. Indeed, 64% of Americans think the murder charges against Casey Anthony are either definitely (20%) or probably (44%) true, according to a July 6 USA Today/���۴�ýpoll. However, with only 16% of Americans following the case "very closely" and 18% describing their reaction to the verdict as "angry," any effect on views of the criminal justice system is likely to be small.
Survey Methods
Results for this ���۴�ýpoll are based on telephone interviews conducted June 9-12, 2011, on the ���۴�ýDaily tracking survey, with a random sample of 1,020 adults, aged 18 and older, living in all 50 U.S. states and the District of Columbia.
For results based on the total sample of national adults, one can say with 95% confidence that the maximum margin of sampling error is ±4 percentage points.
Interviews are conducted with respondents on landline telephones and cellular phones, with interviews conducted in Spanish for respondents who are primarily Spanish-speaking. Each sample includes a minimum quota of 400 cell phone respondents and 600 landline respondents per 1,000 national adults, with additional minimum quotas among landline respondents for gender within region. Landline telephone numbers are chosen at random among listed telephone numbers. Cell phone numbers are selected using random-digit-dial methods. Landline respondents are chosen at random within each household on the basis of which member had the most recent birthday.
Samples are weighted by gender, age, race, Hispanic ethnicity, education, region, adults in the household, and phone status (cell phone only/landline only/both, cell phone mostly, and having an unlisted landline number). Demographic weighting targets are based on the March 2010 Current Population Survey figures for the aged 18 and older non-institutionalized population living in U.S. telephone households. All reported margins of sampling error include the computed design effects for weighting and sample design.
In addition to sampling error, question wording and practical difficulties in conducting surveys can introduce error or bias into the findings of public opinion polls.
For more details on Gallup's polling methodology, visit .
