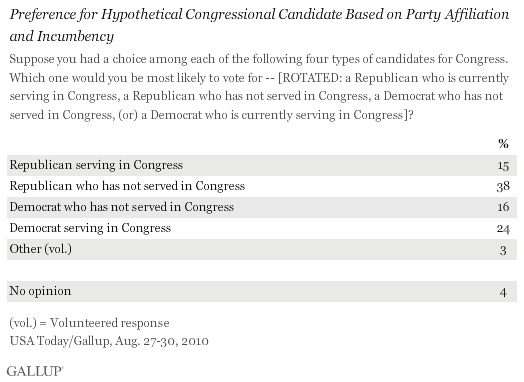
PRINCETON, NJ -- It appears that the best type of candidate to be this fall is a Republican challenger. Given a choice of four hypothetical candidates of differing party affiliations and experience, Americans are most likely to prefer "a Republican who has not served in Congress." Those who would prefer a Democratic candidate opt for an incumbent over a newcomer.

These results, based on an Aug. 27-30 USA Today/���۴�ýpoll, underscore the advantageous political environment for Republicans and non-incumbents this midterm election season. Overall, a majority of Americans prefer a Republican candidate (regardless of experience) to a Democrat, 53% to 40%. And a majority also prefer a non-incumbent (regardless of party affiliation) to an incumbent, 54% to 39%.
The fact that Americans who prefer a Republican candidate want one who is new to Congress suggests that these voters want both GOP control of Congress and the new perspectives that come from members with no prior Washington experience. Americans who favor Democratic candidates, on the other hand, apparently are more satisfied with the type of experienced representatives now in Congress.
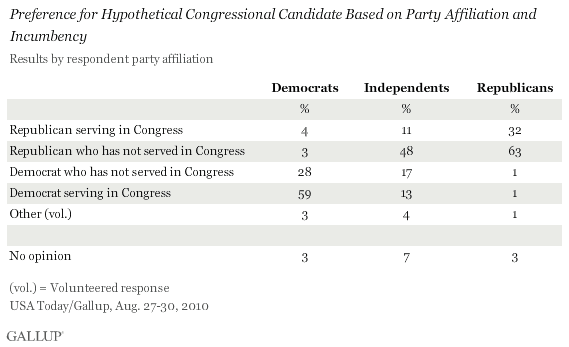
One would naturally expect Democrats to prefer Democratic candidates, and Republicans to prefer Republican candidates, and that is the case when looking at the data by party. But partisans' preferences for incumbents versus challengers seem to be influenced by their knowledge that the Democrats currently have a majority in Congress, and thus, more Democrats will be defending House seats this fall. Democrats are more likely to prefer a Democrat who is in Congress to a Democrat who is not, and Republicans are more likely to prefer a Republican outside of Congress to one who is currently serving there. Independents also show a strong preference for Republican non-incumbents.

The data do not necessarily indicate how Americans would vote in the fall when presented with a choice of two specific candidates for Congress. This fall, voters will generally be asked to choose between one Republican and one Democratic candidate, one of whom may be an incumbent. When asked in the same poll whether they are more likely to vote for the Republican or the Democratic congressional candidate in their district if the elections were held today, 48% of Americans say the Republican and 43% the Democrat.
The appeal of non-incumbents is apparent in another question in the poll that finds 75% of Americans saying Congress would be changed for the better if "most of the present members of Congress are replaced with new members." Only 14% think that would make Congress worse. This is consistent with Gallup's findings from earlier this year suggesting .
Americans across key demographic subgroups widely share the belief that Congress would be improved if most members were turned out of office. However, there is a significant gap by political party, with 89% of Republicans versus 63% of Democrats saying that replacing most members of Congress would be beneficial. Again, the difference likely stems from Democrats' current status as the majority party in Congress.
Implications
In a year when and give relatively low ratings to and , it is not politically beneficial to be either an incumbent or a member of the ruling party. That is reflected in Americans' preference for a Republican newcomer over other types of candidates they may have a chance to vote for in this fall's midterm congressional elections. It is also reflected in prior analysis of historical ���۴�ýdata showing greater seat turnover in Congress when and are unpopular.
Results for this USA Today/���۴�ýpoll are based on telephone interviews conducted Aug. 27-30, 2010, with a random sample of 1,021 adults, aged 18 and older, living in the continental U.S., selected using random-digit-dial sampling.
Both questions reported here were based on a random half sample of approximately 500 national adults each. For results based on these samples of national adults, one can say with 95% confidence that the maximum margin of sampling error is ±5 percentage points.
Interviews are conducted with respondents on landline telephones (for respondents with a landline telephone) and cellular phones (for respondents who are cell phone-only). Each sample includes a minimum quota of 150 cell phone-only respondents and 850 landline respondents, with additional minimum quotas among landline respondents for gender within region. Landline respondents are chosen at random within each household on the basis of which member had the most recent birthday.
Samples are weighted by gender, age, race, education, region, and phone lines. Demographic weighting targets are based on the March 2009 Current Population Survey figures for the aged 18 and older non-institutionalized population living in continental U.S. telephone households. All reported margins of sampling error include the computed design effects for weighting and sample design.
In addition to sampling error, question wording and practical difficulties in conducting surveys can introduce error or bias into the findings of public opinion polls.
View methodology, full question results, and trend data.
For more details on Gallup's polling methodology, visit .
