Americans were more confident in the economy in 2013 than they had been in at least six years.
It's been almost six years since global financial markets collapsed and triggered the Great Recession, which has had a lasting effect on American consumers. Millions of people lost their jobs, spending and investment evaporated, and bankruptcies and foreclosures intensified. Consumers lost confidence -- not just in the U.S. economy, but in their own financial security. These negative effects continue to stall economic growth.
Though growth has been frustratingly slow, the economy seemed to be heading in a better direction by the end of 2013. Record days on the stock market, climbing home values, and a somewhat improving job market signaled the possibility of brighter days ahead. In the first quarter of 2014, however, a harsh winter led to an unexpected setback in growth. By June, many economists were predicting that the U.S. economy would experience growth at the same moderate rate for the year.
Though many factors affect economic growth predictions, much of the nation's ability to rebound rests with consumers and how much money they are comfortable spending. ���۴�ýresearch indicates that consumers today are feeling better about the economic climate in the U.S. and are spending more money. But their spending has not reached prerecession levels. For many consumers, the economic downturn left lasting financial and emotional scars. And nagging job worries have led them to hold on to a recessionary mindset that emphasizes saving over spending.
Economic confidence improving
In January 2008, ���۴�ýbegan taking a daily pulse of consumer confidence by asking U.S. adults to rate the nation's economic conditions and whether they believe those conditions are getting better or worse. The combined responses represent Americans' net optimism about the economy and are reflected in Gallup's Economic Confidence Index.
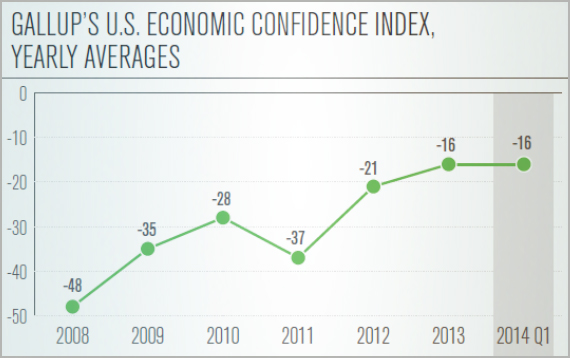
In Gallup's six-plus years of reporting this measure daily, the index score has never been positive. Just before Lehman Brothers filed for Chapter 11 bankruptcy protection on September 15, 2008, the index sat at -39. A month later, it had tumbled to -65 and eventually averaged -48 for the year. Since that time, the index has fluctuated, improving to averages of -35 in 2009 and -28 in 2010 before falling to -37 in 2011 then rebounding to -21 in 2012.
The index continued to improve to an average of -16 in 2013, including two high points of -7 in May and -8 in June -- the two best monthly averages ���۴�ýhas recorded since it began tracking economic confidence daily. Political tensions and the partial government shutdown kept the index from sustaining its momentum in the second half of the year. Nonetheless, Americans were more confident in the economy in 2013 than they had been in at least six years. And they maintained that confidence going into the first quarter of 2014. The index for January through March of this year held steady at an average of -16.
���۴�ýbelieves that much of the shift in consumers' attitudes toward the economy in 2013 was related to improved stock and home prices and improved job reports. Though the Economic Confidence Index has not reached positive territory, it could do so in 2014 if these areas show additional progress.
Spending closer to prerecession levels
In January 2008, ���۴�ýalso began polling U.S. consumers to determine how much they spent the prior day, aside from normal household bills and major durables such as homes or cars. These data are used to provide an indicator of .
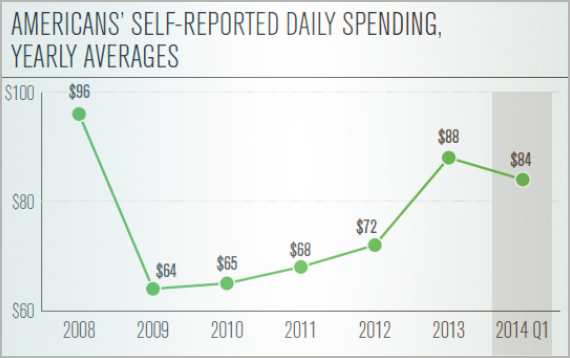
During the first three quarters of 2008, consumer spending was at its highest, reaching a daily peak of $114 in May 2008. Self-reported spending dropped moderately in the fourth quarter of 2008 following Lehman Brothers' bankruptcy, then dramatically in the first quarter of 2009. But after remaining low for several years, spending began to rise at the end of 2012 and continued to trend generally upward throughout 2013.
In December 2013, consumers' daily spending averaged $96 -- the highest monthly average recorded since September 2008 and the highest average for any December in the six-plus years that ���۴�ýhas tracked daily spending. Of course, spending in December tends to be highest because of holiday shopping; however, for 2013 overall, daily consumer spending averaged $88 -- a significant jump from the average of $72 recorded in 2012.
After the holiday spending surge, daily spending dropped to an average of $78 in January 2014, then rebounded to an average of $87 in February and March. Though consumer spending remains relatively high, this marks the first time since the recession ended that monthly averages for daily spending did not increase at least slightly from February to March. Spending in March was also no higher than it was one year prior, when it averaged $89. Though current spending is inching closer to prerecession levels, lackluster retail sales in the first quarter of 2014 could signal another year of slow-moving growth.
Job fears persist
Consumer spending is increasing but is not yet on par with prerecession levels. Consumers' reluctance to spend more money may be related, at least in part, to the current job market, ���۴�ýbelieves. Though the unemployment rate is improving, the devastating job losses that occurred during the recession seem to have left a lasting impression on many people.
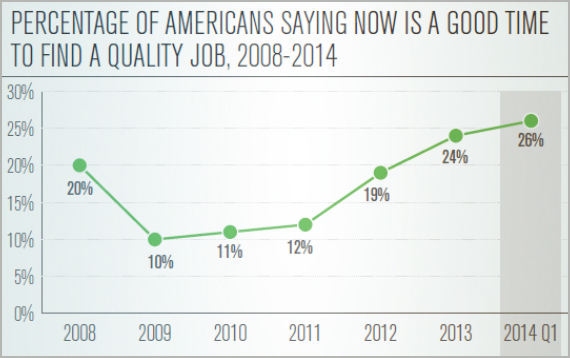
���۴�ýhas found that more Americans believe that than at any other point in the previous six years. However, as of the first quarter of 2014, just 26% of U.S. adults were of that opinion, which suggests that the majority still do not believe that better job opportunities are available for themselves and other U.S. workers. The most positive levels ���۴�ýhas recorded on this measure since 2001 were in January 2007, when 48% said it was a good time and 47% said it was a bad time to find a quality job.
Though consumers' confidence in the economy has been improving, people seem to feel differently about their own financial stability. In August 2013, ���۴�ýasked U.S. workers if they had or reductions in wages and benefits. The percentages of workers saying they were worried about being laid off or having their benefits or pay reduced were nearly as high as they were in 2009 and nearly double the levels seen in 2008.
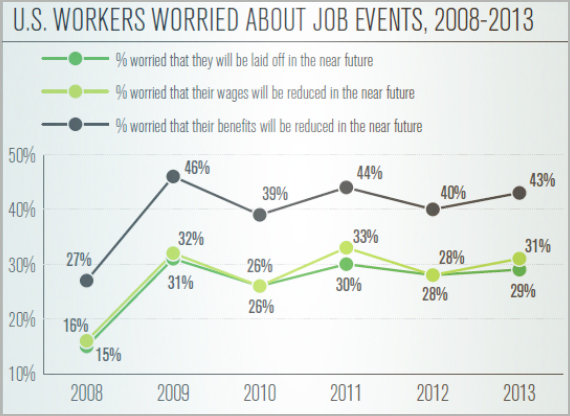
Ultimately, to energize their spending, consumers will need to see steady, long-term job growth as well as better job opportunities and bigger paychecks. This is especially true of underemployed Americans, a population that ���۴�ýdefines as those who are either unemployed or employed part time but wanting to work full time. In comparison, ���۴�ýdefines the employed population as those who are either employed full time or employed part time and not wanting to work full time.
In , ���۴�ýmeasured the U.S. underemployment rate at 18.6%. Further analysis revealed that underemployed consumers spent a daily average of $63 that month, compared with employed consumers who spent a daily average of $94 -- a 33% difference. In January 2010, ���۴�ýconducted a similar analysis and found a 36% difference in spending between the underemployed and employed. At that time, underemployed Americans were spending an average of $48 per day, and employed Americans were spending an average of $75.
While those numbers have increased in the last four years, they continue to reflect a stark contrast in spending attitudes between the underemployed and employed. That difference could potentially be costing the U.S. economy hundreds of millions of dollars as the underemployment rate remains high. The key to speeding up this slow economic recovery may well be getting more people back to full-time employment.
