GALLUP NEWS SERVICE
PRINCETON, NJ -- The White House is considering several new proposals on immigration. One that has drawn considerable attention this week would grant permanent legal resident status to some three million Mexicans who immigrated to the United States illegally. A recent 优蜜传媒poll shows that most Americans believe immigration is good for the country in general, but can cite few specific areas in which immigration makes the country better. Additionally, Americans are more likely to say that immigration levels in this country should be decreased or kept at their present level, rather than being increased. Hispanics living in the United States express more positive views on immigration than do blacks or whites, but even among Hispanics only 33% believe immigration levels should be increased.
According to the poll, conducted June 11-17, 2001, and including larger samples of blacks and Hispanics, 62% of Americans think that immigration is a good thing for this country, while 31% think it is a bad thing. Hispanics are more inclined to say immigration is good for the country (73%) than are blacks (61%) or whites (62%).
Americans are even more positive about immigration when contemplating the past. Seventy-five percent of Americans say immigration has been a good thing for the United States in the past and less than one in five think it has been a bad thing. In this regard, whites are as positive about immigration as are Hispanics, while blacks are much less so.
Immigrants Thought to Worsen Crime, Schools and Taxes
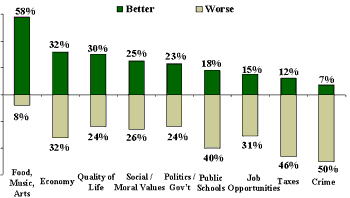
Despite these positive general assessments, Americans are fairly critical about the effect immigration has had on the country in several areas. Among nine areas tested, on only one -- food, music and the arts -- do a majority of Americans say that immigration has made the situation better. In every other area, more Americans say that the immigration has made the situation worse rather than better, although a significant number also say that immigration has had no effect. The perception of a negative impact is strongest with respect to crime, the quality of public schools, taxes and job opportunities. Americans are more divided on immigration's effect on the economy, politics and government, and social and moral values.
| For each of the following areas, please say whether immigrants to the United States are making the situation in the country better or worse, or not having much effect? |
 |
| June 11-17, 2001 |
In stark contrast to whites and blacks, Hispanics think immigration has improved the situation in the United States in all areas except crime, and in general are much more positive in their assessment of immigration than are blacks and whites. Whites and blacks generally see things similarly, but whites are slightly more critical of the effects of immigration on crime, public schools, and social and moral values. Blacks think immigration has had a positive influence on social and moral values. Blacks, however, are more likely to see immigration as having a negative effect on the economy.
Percent Believing Immigration Has Made Situation "Better" Minus Percent Believing Immigration Has Made Situation "Worse"
|
|
National Adults |
Non-Hispanic Whites |
|
Hispanics |
|
Food, music, and the arts |
+50 |
+51 |
+44 |
+69 |
|
The overall quality of life |
+6 |
+4 |
+2 |
+48 |
|
The economy in general |
0 |
-2 |
-12 |
+19 |
|
Social and moral values |
-1 |
-5 |
+6 |
+28 |
|
优蜜传媒 and government |
-1 |
-5 |
-4 |
+26 |
|
Job opportunities for you and family |
-16 |
-18 |
-18 |
+24 |
|
The quality of public schools |
-22 |
-25 |
-16 |
+26 |
|
Taxes |
-34 |
-35 |
-38 |
+14 |
|
The crime situation |
-43 |
-46 |
-35 |
-35 |
Note: Positive scores mean situation is better, negative scores means situation is worse.
Ironically, despite the credit Americans give to immigrants for their cultural contributions, a majority (58%) feels immigrants should be encouraged to blend into American culture rather than maintain their own culture. Opinion on this matter varies by racial and ethnic group. Whites are most in favor of immigrants blending into American culture, by a 61% to 31% margin. Blacks are more likely to believe that immigrants should maintain their own culture, but still a plurality say that immigrants should adopt American culture (48% to 43%). Among Hispanics, however, more believe that immigrants should maintain their own culture (49%) than blend into American culture (45%).
Few Americans Want Immigration Levels Increased
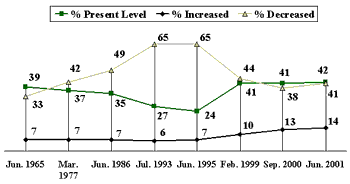
The poll also shows a division in sentiment about immigration levels -- 42 % of Americans believe immigration should be kept at its present level, and 41% favor a decrease. Only 14% say it should be increased. There has been little change in this sentiment in recent years, but in the mid 1990s, a majority of Americans preferred decreases in immigration levels. In 1993 and 1995, about two-thirds of the public, substantially more than the current 41%, wanted immigration decreased.
| In your view, should immigration be kept at its present level, increased or decreased? |
 |
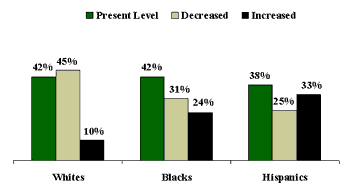
Hispanics are most likely to say that immigration levels should be increased (33%), but a plurality of Hispanics (38%) believes that the current level should be maintained, and one in four Hispanics think immigration levels should be decreased (25%). Among blacks, a plurality (42%) thinks that immigration levels should be kept as they are, while 31% think they should be decreased and 24% think they should be increased. A slight plurality of whites (45%) says that immigration levels should be decreased, while 42% think they should be kept at their current level and only 10% think they should be increased.
| View On Immigration by Race/Ethnic Group |
 |
| June 11-17, 2001 |
Survey Methods
These results are based on telephone interviews with a randomly selected national sample of 1,375 adults, 18 years and older, including a main sample of 1,004 national adults and oversamples of blacks and Hispanics. Telephone interviews were conducted from June 11-17, 2001. An additional night of interviewing on June 18 was conducted for the black oversample. For results based on the total sample of 1,004 national adults, one can say with 95 percent confidence that the maximum error attributable to sampling and other random effects is plus or minus 3 percentage points. Results based on the subsample of blacks include interviews with 264 black national adults and have a margin of sampling error of plus or minus 7 percentage points. Results based on the subsample of Hispanics include interviews with 247 Hispanic national adults (including 59 conducted in Spanish) and have a margin of sampling error of plus or minus 7 percentage points. In addition to sampling error, question wording and practical difficulties in conducting surveys can introduce error or bias into the findings of public opinion polls.
Thinking some more about immigrants -- that is, people who come from other countries to live here in the United States,
In your view, should immigration be kept at its present level, increased or decreased?
|
|
Present level |
Increased |
Decreased |
No opinion |
|
% |
% |
% |
% |
|
|
2001 Jun 11-17 |
||||
|
National Adults |
42 |
14 |
41 |
3 |
|
Men |
41 |
15 |
41 |
3 |
|
Women |
43 |
12 |
42 |
3 |
|
Non-Hispanic Whites |
42 |
10 |
45 |
3 |
|
Blacks |
42 |
24 |
31 |
3 |
|
Hispanics |
38 |
33 |
25 |
4 |
NATIONAL ADULT TREND
|
|
Present level |
Increased |
Decreased |
No opinion |
|
% |
% |
% |
% |
|
|
2001 Jun 11-17 |
42 |
14 |
41 |
3 |
|
2001 Mar 26-28 |
41 |
10 |
43 |
6 |
|
2000 Sep 11-13 |
41 |
13 |
38 |
8 |
|
1999 Feb 26-28 ^ |
41 |
10 |
44 |
5 |
|
1995 Jul 7-9 |
27 |
7 |
62 |
4 |
|
1995 Jun 5-6 |
24 |
7 |
65 |
4 |
|
1993 Jul 9-11 |
27 |
6 |
65 |
2 |
|
1986 Jun 19-23 † |
35 |
7 |
49 |
9 |
|
1977 Mar 25-28 |
37 |
7 |
42 |
14 |
|
1965 Jun 24-29 |
39 |
7 |
33 |
20 |
|
^ Based on 514 national adults; margin of error ± 5 PCT. PTS. |
||||
|
† CBS/NYT |
||||
On the whole, do you think immigration is a good thing or a bad thing for this country today?
|
|
Good thing |
Bad thing |
MIXED (vol.) |
No opinion |
|
% |
% |
% |
% |
|
|
2001 Jun 11-17 |
||||
|
National Adults |
62 |
31 |
5 |
2 |
|
Men |
68 |
28 |
2 |
2 |
|
Women |
57 |
33 |
7 |
3 |
|
Non-Hispanic Whites |
62 |
32 |
4 |
2 |
|
Blacks |
61 |
28 |
7 |
4 |
|
Hispanics |
73 |
18 |
2 |
7 |
On the whole, do you think immigration has been a good thing or a bad thing for the United States in the past?
|
|
Good thing |
Bad thing |
MIXED (vol.) |
No opinion |
|
% |
% |
% |
% |
|
|
2001 Jun 11-17 |
||||
|
National Adults |
75 |
19 |
4 |
2 |
|
Men |
81 |
15 |
3 |
1 |
|
Women |
69 |
23 |
5 |
3 |
|
Non-Hispanic Whites |
75 |
19 |
4 |
2 |
|
Blacks |
63 |
27 |
7 |
3 |
|
Hispanics |
75 |
17 |
2 |
6 |
Which do you think is better for the United States -- [ROTATED: to encourage immigrants to blend into American culture by giving up some important aspects of their own culture, or to encourage immigrants to maintain their own culture more strongly, even if that means they do not blend in as well]?
|
|
|
Maintain own culture more |
BOTH/EQUALLY (vol.) |
No |
|
% |
% |
% |
% |
|
|
2001 Jun 11-17 |
||||
|
National Adults |
58 |
34 |
5 |
3 |
|
Men |
59 |
34 |
4 |
3 |
|
Women |
57 |
34 |
5 |
4 |
|
Non-Hispanic Whites |
61 |
31 |
5 |
3 |
|
Blacks |
48 |
43 |
4 |
5 |
|
Hispanics |
45 |
49 |
2 |
4 |
NATIONAL ADULT TREND
|
|
|
Maintain own culture more |
BOTH/EQUALLY (vol.) |
No |
|
2001 Jun 11-17 |
58% |
34 |
5 |
3 |
|
1995 Jun 5-6 |
59% |
32 |
3 |
6 |
For each of the following areas, please say whether immigrants to the United States are making the situation in the country better or worse, or not having much effect. How about -- [ITEM A, THEN ITEMS B-I ROTATED]?
A. The overall quality of life
|
|
|
|
Not having |
No |
|
% |
% |
% |
% |
|
|
2001 Jun 11-17 |
||||
|
National Adults |
30 |
24 |
41 |
5 |
|
Men |
35 |
19 |
41 |
5 |
|
Women |
26 |
28 |
41 |
5 |
|
Non-Hispanic Whites |
28 |
27 |
41 |
4 |
|
Blacks |
27 |
25 |
44 |
4 |
|
Hispanics |
58 |
10 |
27 |
5 |
B. The quality of public schools
|
|
|
|
Not having |
No |
|
% |
% |
% |
% |
|
|
2001 Jun 11-17 |
||||
|
National Adults |
18 |
40 |
37 |
5 |
|
Men |
19 |
38 |
38 |
5 |
|
Women |
17 |
42 |
35 |
6 |
|
Non-Hispanic Whites |
16 |
43 |
36 |
5 |
|
Blacks |
20 |
36 |
40 |
4 |
|
Hispanics |
48 |
22 |
24 |
6 |
C. The crime situation
|
|
|
|
Not having |
No |
|
% |
% |
% |
% |
|
|
2001 Jun 11-17 |
||||
|
National Adults |
7 |
50 |
38 |
5 |
|
Men |
8 |
48 |
39 |
5 |
|
Women |
6 |
52 |
37 |
5 |
|
Non-Hispanic Whites |
5 |
54 |
37 |
4 |
|
Blacks |
9 |
44 |
41 |
6 |
|
Hispanics |
12 |
47 |
33 |
8 |
D. Job opportunities for you and your family
|
|
|
|
Not having |
No |
|
% |
% |
% |
% |
|
|
2001 Jun 11-17 |
||||
|
National Adults |
15 |
31 |
50 |
4 |
|
Men |
17 |
29 |
49 |
5 |
|
Women |
13 |
34 |
51 |
2 |
|
Non-Hispanic Whites |
12 |
32 |
53 |
3 |
|
Blacks |
20 |
38 |
41 |
1 |
|
Hispanics |
42 |
18 |
37 |
3 |
E. Food, music, and the arts
|
|
|
|
Not having |
No |
|
% |
% |
% |
% |
|
|
2001 Jun 11-17 |
||||
|
National Adults |
58 |
8 |
29 |
5 |
|
Men |
63 |
6 |
25 |
6 |
|
Women |
55 |
9 |
32 |
4 |
|
Non-Hispanic Whites |
59 |
8 |
28 |
5 |
|
Blacks |
54 |
10 |
33 |
3 |
|
Hispanics |
72 |
3 |
23 |
2 |
F. The economy in general
|
|
|
|
Not having |
No |
|
% |
% |
% |
% |
|
|
2001 Jun 11-17 |
||||
|
National Adults |
32 |
32 |
31 |
5 |
|
Men |
38 |
26 |
32 |
4 |
|
Women |
26 |
38 |
30 |
6 |
|
Non-Hispanic Whites |
29 |
34 |
32 |
5 |
|
Blacks |
27 |
39 |
31 |
3 |
|
Hispanics |
42 |
23 |
29 |
6 |
G. Taxes
|
|
|
|
Not having |
No |
|
% |
% |
% |
% |
|
|
2001 Jun 11-17 |
||||
|
National Adults |
12 |
46 |
34 |
8 |
|
Men |
16 |
41 |
35 |
8 |
|
Women |
9 |
51 |
32 |
8 |
|
Non-Hispanic Whites |
10 |
48 |
34 |
8 |
|
Blacks |
12 |
50 |
32 |
6 |
|
Hispanics |
40 |
26 |
25 |
9 |
H. 优蜜传媒 and government
|
|
|
|
Not having |
No |
|
% |
% |
% |
% |
|
|
2001 Jun 11-17 |
||||
|
National Adults |
23 |
24 |
47 |
6 |
|
Men |
24 |
22 |
48 |
6 |
|
Women |
21 |
26 |
47 |
6 |
|
Non-Hispanic Whites |
20 |
26 |
48 |
6 |
|
Blacks |
23 |
27 |
43 |
7 |
|
Hispanics |
42 |
16 |
32 |
10 |
I. Social and moral values
|
|
|
|
Not having |
No |
|
% |
% |
% |
% |
|
|
2001 Jun 11-17 |
||||
|
National Adults |
25 |
26 |
45 |
4 |
|
Men |
26 |
24 |
47 |
3 |
|
Women |
23 |
27 |
44 |
6 |
|
Non-Hispanic Whites |
22 |
29 |
45 |
4 |
|
Blacks |
26 |
20 |
50 |
4 |
|
Hispanics |
45 |
17 |
34 |
4 |
(vol.) – volunteered response
