Story Highlights
- About one in three Americans have at least tried digital health products
- Higher-income households, women, young adults among top users
- Most users say health apps, wearable trackers are helpful to health goals
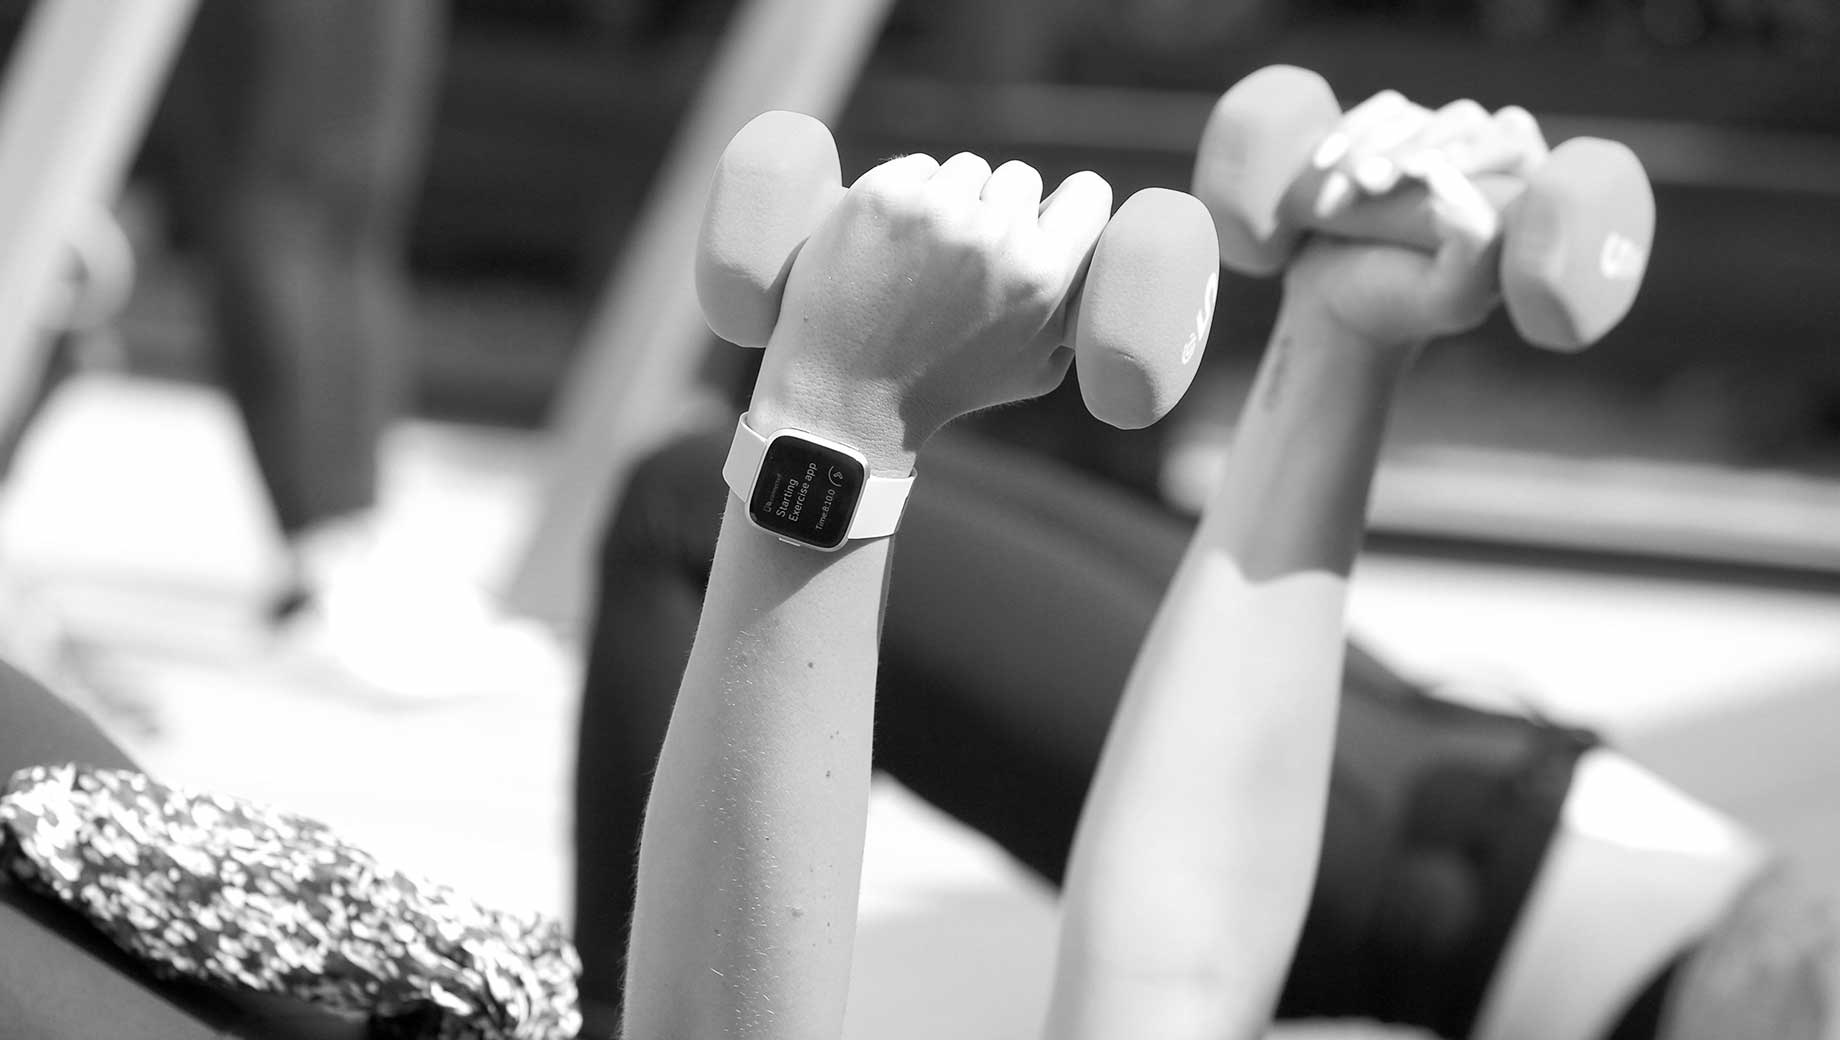
WASHINGTON, D.C. -- Nineteen percent of Americans say they currently use a wearable fitness tracker, with the same percentage saying they currently use a mobile health app. Combining present use with the percentages of Americans saying they have used each of these devices in the past, about one in three Americans report at some point having worn a fitness tracker such as a Fitbit or smartwatch (34%) or having tracked their health statistics on a phone or tablet app (32%).
| Currently do | Have done in past | Have never done | |||||||||||||||||||||||||||||||||||||||||||||||||||||||||||||||||||||||||||||||||||||||||||||||||
|---|---|---|---|---|---|---|---|---|---|---|---|---|---|---|---|---|---|---|---|---|---|---|---|---|---|---|---|---|---|---|---|---|---|---|---|---|---|---|---|---|---|---|---|---|---|---|---|---|---|---|---|---|---|---|---|---|---|---|---|---|---|---|---|---|---|---|---|---|---|---|---|---|---|---|---|---|---|---|---|---|---|---|---|---|---|---|---|---|---|---|---|---|---|---|---|---|---|---|---|
| % | % | % | |||||||||||||||||||||||||||||||||||||||||||||||||||||||||||||||||||||||||||||||||||||||||||||||||
| Wear a fitness tracker such as a Fitbit or smartwatch | 19 | 15 | 66 | ||||||||||||||||||||||||||||||||||||||||||||||||||||||||||||||||||||||||||||||||||||||||||||||||
| Track your health statistics using an app on your smartphone or tablet | 19 | 13 | 67 | ||||||||||||||||||||||||||||||||||||||||||||||||||||||||||||||||||||||||||||||||||||||||||||||||
| Gallup, Nov. 1-14, 2019 | |||||||||||||||||||||||||||||||||||||||||||||||||||||||||||||||||||||||||||||||||||||||||||||||||||
More than one in four Americans currently use one product or the other: 8% are actively using only a fitness tracker, 9% are actively using only a mobile health app, and 10% are actively using both.
Combining both current and past users, nearly half of Americans (45%) have at least tried one or more of the digital health products: 13% have tried or currently use only a fitness tracker, 12% have tried or currently use only a mobile health app, and 20% have tried both products.
These data are from Gallup's annual Health and Healthcare survey, conducted Nov. 1-14. The U.S. is the second-largest market in the world for wearable devices, according to the International Data Corporation. The most popular wearable device brands in the U.S. in late 2018 were Apple, Xiaomi and Fitbit.
Meanwhile, Americans have a variety of health applications available to them on their mobile devices -- both free and paid -- that can be used to track fitness, nutrition, stress, sleep and other health-related statistics. Some health apps link to wearable devices.
High-Income Households, Young Adults and Women Among Top Users
Use of these products varies across subgroups:
-
Roughly half of U.S. adults in upper-income households report being current or former users of both fitness trackers and health apps, whereas about one in three adults in middle-income households report having used these products -- and about one in four among those in lower-income households.
-
Fitness trackers and health apps are a bit more popular among women than among men. Meanwhile, adults younger than 55 are about twice as likely to have used these products as are adults aged 55 and older.
-
Gender and age differences are accentuated when considering both together -- nearly half of women younger than 50 report having used these products, while men aged 50 and older are the least likely among the four gender-age groups to report having used them.
-
Thirty-five percent or more of city and suburban residents report having used these products, while fewer than three in 10 residents of rural areas have used either one.
| Currently wear tracker | Have worn tracker in past | Currently use health app | Have used health app in past | ||||||||||||||||||||||||||||||||||||||||||||||||||||||||||||||||||||||||||||||||||||||||||||||||
|---|---|---|---|---|---|---|---|---|---|---|---|---|---|---|---|---|---|---|---|---|---|---|---|---|---|---|---|---|---|---|---|---|---|---|---|---|---|---|---|---|---|---|---|---|---|---|---|---|---|---|---|---|---|---|---|---|---|---|---|---|---|---|---|---|---|---|---|---|---|---|---|---|---|---|---|---|---|---|---|---|---|---|---|---|---|---|---|---|---|---|---|---|---|---|---|---|---|---|---|
| % | % | % | % | ||||||||||||||||||||||||||||||||||||||||||||||||||||||||||||||||||||||||||||||||||||||||||||||||
| Men | 16 | 12 | 20 | 9 | |||||||||||||||||||||||||||||||||||||||||||||||||||||||||||||||||||||||||||||||||||||||||||||||
| Women | 21 | 17 | 17 | 17 | |||||||||||||||||||||||||||||||||||||||||||||||||||||||||||||||||||||||||||||||||||||||||||||||
| 18-34 | 28 | 17 | 25 | 16 | |||||||||||||||||||||||||||||||||||||||||||||||||||||||||||||||||||||||||||||||||||||||||||||||
| 35-54 | 22 | 17 | 24 | 18 | |||||||||||||||||||||||||||||||||||||||||||||||||||||||||||||||||||||||||||||||||||||||||||||||
| 55+ | 10 | 11 | 12 | 7 | |||||||||||||||||||||||||||||||||||||||||||||||||||||||||||||||||||||||||||||||||||||||||||||||
| Men, 18-49 | 21 | 17 | 25 | 11 | |||||||||||||||||||||||||||||||||||||||||||||||||||||||||||||||||||||||||||||||||||||||||||||||
| Men, 50+ | 10 | 7 | 16 | 8 | |||||||||||||||||||||||||||||||||||||||||||||||||||||||||||||||||||||||||||||||||||||||||||||||
| Women, 18-49 | 31 | 18 | 22 | 25 | |||||||||||||||||||||||||||||||||||||||||||||||||||||||||||||||||||||||||||||||||||||||||||||||
| Women, 50+ | 13 | 15 | 13 | 8 | |||||||||||||||||||||||||||||||||||||||||||||||||||||||||||||||||||||||||||||||||||||||||||||||
| Big/Small city | 22 | 13 | 21 | 14 | |||||||||||||||||||||||||||||||||||||||||||||||||||||||||||||||||||||||||||||||||||||||||||||||
| Suburb | 21 | 21 | 19 | 15 | |||||||||||||||||||||||||||||||||||||||||||||||||||||||||||||||||||||||||||||||||||||||||||||||
| Town/Rural area | 13 | 12 | 16 | 13 | |||||||||||||||||||||||||||||||||||||||||||||||||||||||||||||||||||||||||||||||||||||||||||||||
| <$40,000 | 14 | 8 | 15 | 10 | |||||||||||||||||||||||||||||||||||||||||||||||||||||||||||||||||||||||||||||||||||||||||||||||
| $40,000-<$100,000 | 16 | 17 | 20 | 12 | |||||||||||||||||||||||||||||||||||||||||||||||||||||||||||||||||||||||||||||||||||||||||||||||
| $100,000+ | 31 | 20 | 26 | 21 | |||||||||||||||||||||||||||||||||||||||||||||||||||||||||||||||||||||||||||||||||||||||||||||||
| Gallup, Nov. 1-14, 2019 | |||||||||||||||||||||||||||||||||||||||||||||||||||||||||||||||||||||||||||||||||||||||||||||||||||
Most Users Rate the Products as Helpful in Reaching Health Goals
优蜜传媒also followed up with those who reported having used fitness trackers or health apps about the products' helpfulness in reaching their health goals.
About three in four current or former users of wearable fitness trackers say they find them very (30%) or somewhat helpful (46%). Even more health app users (82%) say they find them very (29%) or somewhat helpful (53%).
| Very helpful | Somewhat helpful | Not very helpful | Not at all helpful | ||||||||||||||||||||||||||||||||||||||||||||||||||||||||||||||||||||||||||||||||||||||||||||||||
|---|---|---|---|---|---|---|---|---|---|---|---|---|---|---|---|---|---|---|---|---|---|---|---|---|---|---|---|---|---|---|---|---|---|---|---|---|---|---|---|---|---|---|---|---|---|---|---|---|---|---|---|---|---|---|---|---|---|---|---|---|---|---|---|---|---|---|---|---|---|---|---|---|---|---|---|---|---|---|---|---|---|---|---|---|---|---|---|---|---|---|---|---|---|---|---|---|---|---|---|
| % | % | % | % | ||||||||||||||||||||||||||||||||||||||||||||||||||||||||||||||||||||||||||||||||||||||||||||||||
| Wearing a fitness tracker such as a Fitbit or smartwatch | 30 | 46 | 16 | 8 | |||||||||||||||||||||||||||||||||||||||||||||||||||||||||||||||||||||||||||||||||||||||||||||||
| Tracking your health statistics using an app | 29 | 53 | 13 | 5 | |||||||||||||||||||||||||||||||||||||||||||||||||||||||||||||||||||||||||||||||||||||||||||||||
| Gallup, Nov. 1-14, 2019 | |||||||||||||||||||||||||||||||||||||||||||||||||||||||||||||||||||||||||||||||||||||||||||||||||||
As might be expected, current users of both products are more likely than past users to report the products as being helpful.
The vast majority of current wearable fitness tracker users (85%) and health application users (92%) say the products are very or somewhat helpful. The majority of past users are positive about the products' helpfulness, but to a lesser degree than current users: 64% say wearable fitness trackers were very or somewhat helpful, and 69% rate health apps positively.
| Very/Somewhat helpful | Not very helpful/Not at all helpful | ||||||||||||||||||||||||||||||||||||||||||||||||||||||||||||||||||||||||||||||||||||||||||||||||||
|---|---|---|---|---|---|---|---|---|---|---|---|---|---|---|---|---|---|---|---|---|---|---|---|---|---|---|---|---|---|---|---|---|---|---|---|---|---|---|---|---|---|---|---|---|---|---|---|---|---|---|---|---|---|---|---|---|---|---|---|---|---|---|---|---|---|---|---|---|---|---|---|---|---|---|---|---|---|---|---|---|---|---|---|---|---|---|---|---|---|---|---|---|---|---|---|---|---|---|---|
| % | % | ||||||||||||||||||||||||||||||||||||||||||||||||||||||||||||||||||||||||||||||||||||||||||||||||||
| Current wearable users | 85 | 15 | |||||||||||||||||||||||||||||||||||||||||||||||||||||||||||||||||||||||||||||||||||||||||||||||||
| Past wearable users | 64 | 36 | |||||||||||||||||||||||||||||||||||||||||||||||||||||||||||||||||||||||||||||||||||||||||||||||||
| Current health app users | 92 | 9 | |||||||||||||||||||||||||||||||||||||||||||||||||||||||||||||||||||||||||||||||||||||||||||||||||
| Past health app users | 69 | 30 | |||||||||||||||||||||||||||||||||||||||||||||||||||||||||||||||||||||||||||||||||||||||||||||||||
| Gallup, Nov. 1-14, 2019 | |||||||||||||||||||||||||||||||||||||||||||||||||||||||||||||||||||||||||||||||||||||||||||||||||||
Bottom Line
More than one in four adults across the U.S. are currently measuring their steps, exercise, sleep or other personal health information as they go about their daily lives -- amassing a vast amount of data for companies that oversee the devices and applications they use.
Most users are positive in their reports of the products' helpfulness in reaching their health goals, and among those who have at least tried the products, active users currently outnumber former users.
Though Gallup's initial measure of usership of these products finds a substantial number of Americans using them, that's not to say that usership in the U.S. is on the rise. According to the International Data Corporation, the U.S. market for wearable devices "saw its year-over-year growth decline 0.4% as it transitions from a market driven by new users to one that relies on replacement devices and upgrades."
Meanwhile, the recent acquisition of Fitbit by Google -- of whom Americans' concerns about invasion of privacy grew from 2011 to 2018 -- has raised concerns among users who don't want their personal data compromised. Both companies have stated their commitment to customers' privacy, and Google said it wouldn't sell users' personal data.
This is just one of many new frontiers where Americans are entrusting their personal data to a tech company. And while there isn't yet a majority-level desire for greater regulation of Big Tech, that could change if Americans sense the risks of data breaches or intentional mining are hitting closer to home -- in this case, data about their physical metrics and health.
View complete question responses and trends.
Learn more about how the works.


