Story Highlights
- 47% of Americans would vote for a socialist
- Willingness to vote for evangelical, Muslim or atheist candidates grows
- 76% would vote for gay or lesbian candidate -- a new high
WASHINGTON, D.C. -- Less than half of Americans (47%) say they would vote for a qualified presidential candidate who is a socialist -- the same percentage ���۴�ýfound in 2015. A socialist candidate is the only one among a dozen hypothetical candidates about whom a minority of Americans say they are willing to give their vote.
| 2015 | 2019 | Change | |||||||||||||||||||||||||||||||||||||||||||||||||||||||||||||||||||||||||||||||||||||||||||||||||
|---|---|---|---|---|---|---|---|---|---|---|---|---|---|---|---|---|---|---|---|---|---|---|---|---|---|---|---|---|---|---|---|---|---|---|---|---|---|---|---|---|---|---|---|---|---|---|---|---|---|---|---|---|---|---|---|---|---|---|---|---|---|---|---|---|---|---|---|---|---|---|---|---|---|---|---|---|---|---|---|---|---|---|---|---|---|---|---|---|---|---|---|---|---|---|---|---|---|---|---|
| % | % | (pct. pts.) | |||||||||||||||||||||||||||||||||||||||||||||||||||||||||||||||||||||||||||||||||||||||||||||||||
| Black | 92 | 96 | +4 | ||||||||||||||||||||||||||||||||||||||||||||||||||||||||||||||||||||||||||||||||||||||||||||||||
| Catholic | 93 | 95 | +2 | ||||||||||||||||||||||||||||||||||||||||||||||||||||||||||||||||||||||||||||||||||||||||||||||||
| Hispanic | 91 | 95 | +4 | ||||||||||||||||||||||||||||||||||||||||||||||||||||||||||||||||||||||||||||||||||||||||||||||||
| A woman | 92 | 94 | +2 | ||||||||||||||||||||||||||||||||||||||||||||||||||||||||||||||||||||||||||||||||||||||||||||||||
| Jewish | 91 | 93 | +2 | ||||||||||||||||||||||||||||||||||||||||||||||||||||||||||||||||||||||||||||||||||||||||||||||||
| An evangelical Christian | 73 | 80 | +7 | ||||||||||||||||||||||||||||||||||||||||||||||||||||||||||||||||||||||||||||||||||||||||||||||||
| Gay or lesbian | 74 | 76 | +2 | ||||||||||||||||||||||||||||||||||||||||||||||||||||||||||||||||||||||||||||||||||||||||||||||||
| Under the age of 40 | -- | 71 | -- | ||||||||||||||||||||||||||||||||||||||||||||||||||||||||||||||||||||||||||||||||||||||||||||||||
| Muslim | 60 | 66 | +6 | ||||||||||||||||||||||||||||||||||||||||||||||||||||||||||||||||||||||||||||||||||||||||||||||||
| Over the age of 70 | -- | 63 | -- | ||||||||||||||||||||||||||||||||||||||||||||||||||||||||||||||||||||||||||||||||||||||||||||||||
| An atheist | 58 | 60 | +2 | ||||||||||||||||||||||||||||||||||||||||||||||||||||||||||||||||||||||||||||||||||||||||||||||||
| A socialist | 47 | 47 | 0 | ||||||||||||||||||||||||||||||||||||||||||||||||||||||||||||||||||||||||||||||||||||||||||||||||
| Gallup | |||||||||||||||||||||||||||||||||||||||||||||||||||||||||||||||||||||||||||||||||||||||||||||||||||
Among religious identities, more than nine in 10 Americans say they are willing to vote for a qualified Catholic or Jewish candidate, while smaller majorities say they are willing to vote for an evangelical Christian (80%), a Muslim (66%) or an atheist (60%).
Meanwhile, Americans are nearly universally willing to vote for a black (96%) or Hispanic (95%) candidate -- and the same is true for their willingness to vote for a woman (92%). More than three in four say they would vote for a gay or lesbian candidate.
With a wide range of ages in the current field of candidates for president, ���۴�ýfinds that most Americans are willing to vote for a candidate over the age of 70 (63%), and an even larger majority would vote for a candidate under the age of 40 (71%).
These data are from Gallup's latest poll, conducted April 17-30, as a large and diverse slate of candidates running for the Democratic nomination takes shape. ���۴�ýhas asked Americans about their willingness to vote for candidates with certain background characteristics since 1937, to see whether Americans were open to embracing nontraditional presidential candidates.
Over time, Americans have become more likely to say they would vote for such candidates, and this has been manifested in the real world with the election of a black president in 2008, and major-party nominations for a Mormon candidate in 2012 and a female candidate in 2016, all firsts in U.S. presidential election history.
More Openness to Candidates With Certain Religious Identities Than in Past
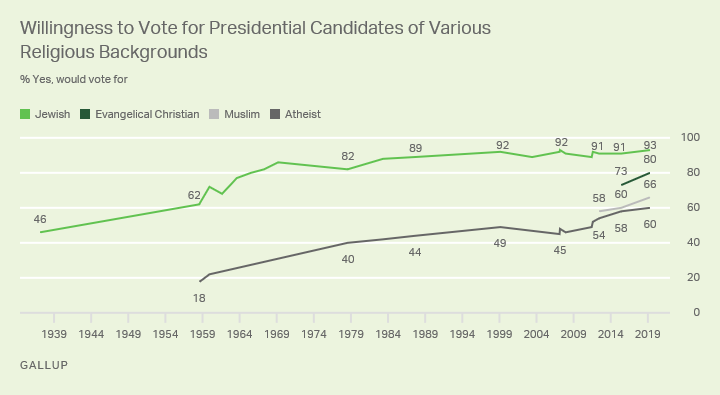
Americans are now nearly universally willing to vote for a Jewish or Catholic presidential candidate, but this has not always been the case. In 1937, less than half of Americans said they would vote for a Jewish candidate and six in 10 said they would vote for a Catholic candidate. In recent years, Americans have also grown more open to voting for candidates of other religious identities.
Eighty percent of U.S. adults would vote for an evangelical Christian for president -- up from 73% in 2015. Meanwhile, the percentage of Americans who would vote for a Muslim has grown from 58% in 2012 to 66% today.
Atheist presidential candidates would face more resistance from voters than candidates of other religious backgrounds. But Americans have warmed to the idea of an atheist candidate over the past several decades. The current 60% who would vote for an atheist is more than three times the 18% ���۴�ýrecorded in its first measure on atheist candidates in 1958.
New High in Willingness to Vote for a Gay Candidate
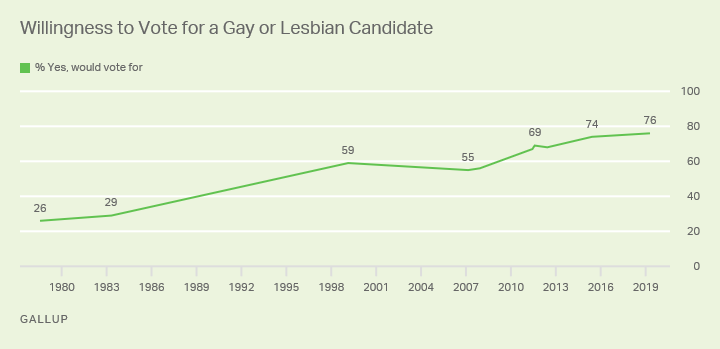
As openly gay South Bend, Indiana, Mayor Pete Buttigieg's campaign for president has generated buzz in the Democratic nomination race, 76% of Americans report a willingness to vote for a gay or lesbian candidate -- a new high in Gallup's trend.
Americans are now about three times as likely to say they would vote for a qualified gay or lesbian candidate for president as they were when ���۴�ýfirst asked the question in 1978.
Electability of Candidates With Certain Backgrounds Varies by Political Party
The focus of the nomination campaign will be on the Democrats, with Republican President Donald Trump unlikely to face a serious challenge for the GOP nomination. Most Democrats are willing to vote for all of the groups ���۴�ýasked about this year -- and many of these groups are represented by candidates in the current field.
On the low end of Democrats' openness to candidates, about two in three Democrats say they would vote for a candidate over the age of 70, a potential weakness for current front-runners Joe Biden and Bernie Sanders. Democrats are much more likely to say they would vote for a candidate under the age of 40 (78%), which could potentially boost Buttigieg's chances in the primaries. Independents, too, are more likely to say they would vote for a candidate under 40 than a candidate over 70, while Republicans have similar preferences for the two age groups.
As political figures espousing socialist ideas have gained popularity among their party in recent years, about three in four Democrats (74%) say they would support a self-identified socialist, up from 59% in 2015. This increase may partly be the result of Sanders' 2016 campaign, in which he touted some socialist ideas and had a solid performance in the primaries.
Meanwhile, socialist candidates remain unpopular among the GOP rank-and-file -- 19% would vote for a socialist for president, down from 26% in 2015. Just 49% of independents would vote for a socialist, a potential problem for the Democrats if they nominate a left-leaning candidate who supports socialist-style programs. Only on the question of an evangelical Christian candidate do a larger proportion of Republicans than Democrats say they would vote for such a candidate. The 92% of Republicans saying they would vote for an evangelical Christian (compared with 71% of Democrats) is on par with this group's willingness to vote for a woman or a Hispanic.
| Republicans | Independents | Democrats | |||||||||||||||||||||||||||||||||||||||||||||||||||||||||||||||||||||||||||||||||||||||||||||||||
|---|---|---|---|---|---|---|---|---|---|---|---|---|---|---|---|---|---|---|---|---|---|---|---|---|---|---|---|---|---|---|---|---|---|---|---|---|---|---|---|---|---|---|---|---|---|---|---|---|---|---|---|---|---|---|---|---|---|---|---|---|---|---|---|---|---|---|---|---|---|---|---|---|---|---|---|---|---|---|---|---|---|---|---|---|---|---|---|---|---|---|---|---|---|---|---|---|---|---|---|
| % Yes, would | % Yes, would | % Yes, would | |||||||||||||||||||||||||||||||||||||||||||||||||||||||||||||||||||||||||||||||||||||||||||||||||
| Black | 94 | 96 | 99 | ||||||||||||||||||||||||||||||||||||||||||||||||||||||||||||||||||||||||||||||||||||||||||||||||
| Catholic | 97 | 94 | 96 | ||||||||||||||||||||||||||||||||||||||||||||||||||||||||||||||||||||||||||||||||||||||||||||||||
| Hispanic | 92 | 97 | 97 | ||||||||||||||||||||||||||||||||||||||||||||||||||||||||||||||||||||||||||||||||||||||||||||||||
| A woman | 90 | 94 | 97 | ||||||||||||||||||||||||||||||||||||||||||||||||||||||||||||||||||||||||||||||||||||||||||||||||
| Jewish | 94 | 91 | 94 | ||||||||||||||||||||||||||||||||||||||||||||||||||||||||||||||||||||||||||||||||||||||||||||||||
| An evangelical Christian | 92 | 79 | 71 | ||||||||||||||||||||||||||||||||||||||||||||||||||||||||||||||||||||||||||||||||||||||||||||||||
| Gay or lesbian | 61 | 82 | 83 | ||||||||||||||||||||||||||||||||||||||||||||||||||||||||||||||||||||||||||||||||||||||||||||||||
| Under the age of 40 | 65 | 71 | 78 | ||||||||||||||||||||||||||||||||||||||||||||||||||||||||||||||||||||||||||||||||||||||||||||||||
| Muslim | 38 | 73 | 86 | ||||||||||||||||||||||||||||||||||||||||||||||||||||||||||||||||||||||||||||||||||||||||||||||||
| Over the age of 70 | 63 | 62 | 65 | ||||||||||||||||||||||||||||||||||||||||||||||||||||||||||||||||||||||||||||||||||||||||||||||||
| An atheist | 42 | 66 | 71 | ||||||||||||||||||||||||||||||||||||||||||||||||||||||||||||||||||||||||||||||||||||||||||||||||
| A socialist | 19 | 49 | 74 | ||||||||||||||||||||||||||||||||||||||||||||||||||||||||||||||||||||||||||||||||||||||||||||||||
| Gallup, April 17-30, 2019 | |||||||||||||||||||||||||||||||||||||||||||||||||||||||||||||||||||||||||||||||||||||||||||||||||||
Bottom Line
With a large and diverse field of candidates competing for the Democratic nomination, next year's primaries and general election could result in the oldest or youngest president ever elected, as well as the first female, Hispanic, Jewish or gay president. Americans are mostly open to these possibilities -- though willingness to vote for candidates with these characteristics varies by political affiliation.
Religious identification may be becoming less relevant in national politics, as most Americans are open to voting for all groups ���۴�ýasks about. If these trends continue, evangelicals, Muslims and atheists may one day find their electability on par with that of Catholics and Jews -- both of which were once much more contentious for a presidential candidate. Gallup's first poll on the question in 1937, for example, found that 47% of Americans would vote for a Jewish candidate -- a far cry from the 93% today.
The electability of a gay or lesbian candidate has also grown over time, much like Americans' views at large on gay rights and acceptance of this group.
In spite of the expanded tolerance for diversity, candidates labeling themselves as socialists may struggle to gain traction in a presidential race, as Americans have not become more open to such a candidate. Even as political figures advocating socialist ideas have gained popularity in Democratic circles in recent years, less than half of Americans remain willing to give an avowed socialist candidate their vote. This creates a challenge for the Democratic Party, as it seeks to avoid alienating the Democratic socialists within its rank and file, while still aiming to win a national election.
View complete question responses and trends (PDF download).
Learn more about how the works.

