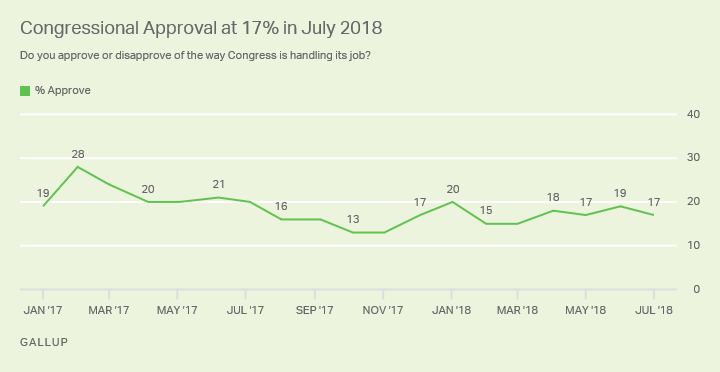
WASHINGTON, D.C. -- Seventeen percent of Americans in July approve of the job Congress is doing, consistent with the 15% to 19% ratings the legislative body has received in Gallup's monthly readings since February.

The latest approval rating comes from a ���۴�ýpoll conducted July 1-11, as the U.S. Senate prepares for what could be a contentious confirmation vote for President Donald Trump's Supreme Court nominee, Brett Kavanaugh.
Background: Congress' job approval rating has varied little over the past six months. Americans' approval of Congress was slightly lower last fall, with twin readings of 13% in October and November, but it rose to 20% in January, after passage of Trump's tax bill in late December.
Americans were a bit more positive about Congress in the early months of Trump's presidency, averaging 22% approval from February to July 2017 -- reflecting improved Republican sentiment after Trump's inauguration. But this was short-lived, as the figure dropped to 16% in August 2017 and has since averaged 16%.
The overall average approval rating for Congress over Gallup's history of asking the question since 1974 is 30%.
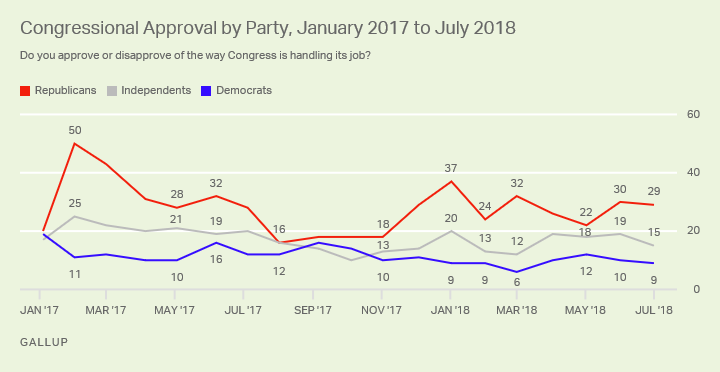
Republicans (29%) remain most approving of Congress, as their party currently controls both legislative chambers. Meanwhile, Democrats (9%) remain least approving, while 15% of independents approve. Figures for each party group are similar to their June ratings. Republicans' ratings are well below where they were in February 2017, after Trump took office, and significantly lower than in January of this year, after the tax cuts were passed.

Survey Methods
Results for this ���۴�ýpoll are based on telephone interviews conducted July 1-11, 2018, with a random sample of 1,033 adults, aged 18 and older, living in all 50 U.S. states and the District of Columbia. For results based on the total sample of national adults, the margin of sampling error is ±4 percentage points at the 95% confidence level. All reported margins of sampling error include computed design effects for weighting.
Each sample of national adults includes a minimum quota of 70% cellphone respondents and 30% landline respondents, with additional minimum quotas by time zone within region. Landline and cellular telephone numbers are selected using random-digit-dial methods.
View survey methodology, complete question responses and trends.
Learn more about how the works.


