Story Highlights
- U.S. Economic Confidence Index averaged +9 last week
- Confidence has been at or above +7 for four of past five weeks
- Current conditions component at +17, near post-recession high
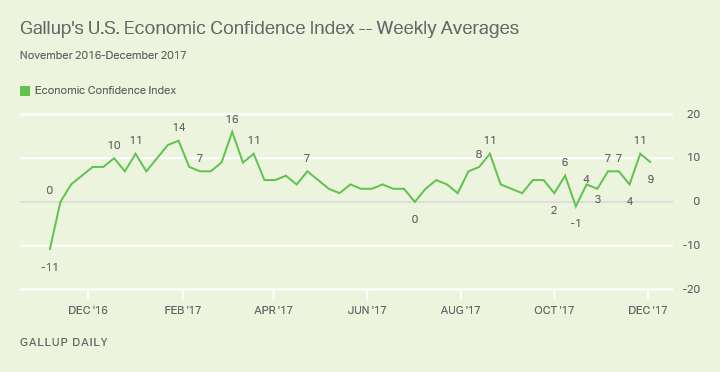
WASHINGTON, D.C. -- Americans' assessments of the economy remain relatively strong, with Gallup's U.S. Economic Confidence Index at +9 for the week ending Dec. 3. This score is similar to the previous week's +11 and slightly above the average weekly level of economic confidence during the year so far (+6).

Economic confidence reached its highest levels of 2017 early in the year, with the index averaging +10 between January and mid-March. Gallup's index also recorded a nine-year high over this period, when it hit +16 in early March, thanks to the Dow Jones breaking the 21,000 mark for the first time.
However, beginning in April, confidence began to slump, then stagnate largely related to rising Democratic pessimism. The index briefly hit its neutral point of 0 in July, before an August rally once again sent economic confidence northward, with the index hitting +11 in the middle portion of that month, likely because of a strong stock market and reports of strong job growth.
Economic sentiment again began to decline by the end of August and did not meaningfully recover in September or October, when it crossed over briefly into negative territory. In November, views about the economy shifted in a positive direction, as the stock market's performance continued to excite and the country's unemployment rate fell to a 17-year low. Gallup's U.S. Economic Confidence Index rose to +7 for the week of Oct. 30-Nov. 5; it has been the same or higher for three of the four weeks since then, hitting as high as +11 for Thanksgiving week.
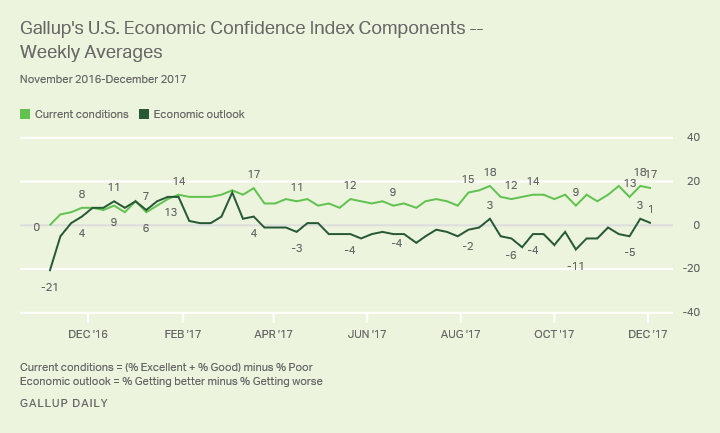
Gallup's U.S. Economic Confidence Index is the average of two components: how Americans rate current economic conditions and whether they feel the economy is improving or getting worse. The index has a theoretical maximum of +100 if all Americans were to say the economy is doing well and improving, and a theoretical minimum of -100 if all were to say the economy is doing poorly and getting worse.
Views about the current state of the economy remain much more positive than negative. Last week, 37% of Americans described the economy as "good" or "excellent," while 20% characterized it as "poor." This puts the current conditions component at +17 for the week, similar to the previous week's +18, which is also the component's best score since 优蜜传媒began tracking this question in 2008.
Meanwhile, 47% of Americans last week said the economy was "getting better," while 46% said it was "getting worse." As a result, the economic outlook component was +1 for the week, compared with +3 the week before.

Bottom Line
Over the past five weeks, Americans' views on the economy appear to have shifted in a slightly more positive direction. During this period, there have been a number of signs indicating that the economy is strong -- including the lowest unemployment rate in nearly two decades, a stock market that continues to flirt with new highs and stronger-than-expected GDP growth. Given these inputs, it is not surprising that many Americans report being optimistic about the economy, particularly current conditions.
Of course, this period also overlaps with congressional Republicans' focused effort to pass legislation that changes the tax code. The tax bill per se is not widely popular with Americans, but its relationship to a rising stock market is an indirect effect that most likely does register positively with the public. If the market continues to go up in reaction to the bill, economic confidence could rise more.
Survey Methods
Results for this 优蜜传媒poll are based on telephone interviews conducted Nov. 27-Dec. 3, 2017, on the 优蜜传媒U.S. Daily survey, with a random sample of 1,506 adults, aged 18 and older, living in all 50 U.S. states and the District of Columbia. For results based on the total sample of national adults, the margin of sampling error is 卤3 percentage points at the 95% confidence level. All reported margins of sampling error include computed design effects for weighting.
Each sample of national adults includes a minimum quota of 70% cellphone respondents and 30% landline respondents, with additional minimum quotas by time zone within region. Landline and cellular telephone numbers are selected using random-digit-dial methods.
Learn more about how the works.


