Story Highlights
- Images of six industries improved in past year
- Other industries held steady, while none lost ground
- Republicans fuel most of this year's gains
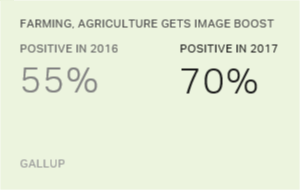
WASHINGTON, D.C. -- Americans' overall impressions of six major sectors of the U.S. economy grew significantly more positive this year. Farming and agriculture saw the biggest improvement, with 70% now viewing it positively, up 15 percentage points from 2016. Americans are also more positive about education, the computer, real estate and sports industries, and the legal field.
| 2016 | 2017 | Change | ||||||||||||||||||||||||||||||||||||||||||||||||||||||||||||||||||||||||||||||||||||||||||||||||||
|---|---|---|---|---|---|---|---|---|---|---|---|---|---|---|---|---|---|---|---|---|---|---|---|---|---|---|---|---|---|---|---|---|---|---|---|---|---|---|---|---|---|---|---|---|---|---|---|---|---|---|---|---|---|---|---|---|---|---|---|---|---|---|---|---|---|---|---|---|---|---|---|---|---|---|---|---|---|---|---|---|---|---|---|---|---|---|---|---|---|---|---|---|---|---|---|---|---|---|---|---|
| % | % | pct. pts. | ||||||||||||||||||||||||||||||||||||||||||||||||||||||||||||||||||||||||||||||||||||||||||||||||||
| Up significantly in 2017 | ||||||||||||||||||||||||||||||||||||||||||||||||||||||||||||||||||||||||||||||||||||||||||||||||||||
| Farming and agriculture* | 55 | 70 | 15 | |||||||||||||||||||||||||||||||||||||||||||||||||||||||||||||||||||||||||||||||||||||||||||||||||
| Education* | 44 | 55 | 11 | |||||||||||||||||||||||||||||||||||||||||||||||||||||||||||||||||||||||||||||||||||||||||||||||||
| Computer industry* | 66 | 75 | 9 | |||||||||||||||||||||||||||||||||||||||||||||||||||||||||||||||||||||||||||||||||||||||||||||||||
| Real estate industry* | 44 | 53 | 9 | |||||||||||||||||||||||||||||||||||||||||||||||||||||||||||||||||||||||||||||||||||||||||||||||||
| The legal field* | 31 | 40 | 9 | |||||||||||||||||||||||||||||||||||||||||||||||||||||||||||||||||||||||||||||||||||||||||||||||||
| Sports industry* | 41 | 49 | 8 | |||||||||||||||||||||||||||||||||||||||||||||||||||||||||||||||||||||||||||||||||||||||||||||||||
| Not up significantly in 2017 | ||||||||||||||||||||||||||||||||||||||||||||||||||||||||||||||||||||||||||||||||||||||||||||||||||||
| Publishing industry | 39 | 46 | 7 | |||||||||||||||||||||||||||||||||||||||||||||||||||||||||||||||||||||||||||||||||||||||||||||||||
| Automobile industry* | 50 | 56 | 6 | |||||||||||||||||||||||||||||||||||||||||||||||||||||||||||||||||||||||||||||||||||||||||||||||||
| Grocery industry | 54 | 60 | 6 | |||||||||||||||||||||||||||||||||||||||||||||||||||||||||||||||||||||||||||||||||||||||||||||||||
| Internet industry | 53 | 59 | 6 | |||||||||||||||||||||||||||||||||||||||||||||||||||||||||||||||||||||||||||||||||||||||||||||||||
| Restaurant industry* | 66 | 72 | 6 | |||||||||||||||||||||||||||||||||||||||||||||||||||||||||||||||||||||||||||||||||||||||||||||||||
| Banking | 38 | 43 | 5 | |||||||||||||||||||||||||||||||||||||||||||||||||||||||||||||||||||||||||||||||||||||||||||||||||
| Pharmaceutical industry | 28 | 33 | 5 | |||||||||||||||||||||||||||||||||||||||||||||||||||||||||||||||||||||||||||||||||||||||||||||||||
| Telephone industry* | 42 | 47 | 5 | |||||||||||||||||||||||||||||||||||||||||||||||||||||||||||||||||||||||||||||||||||||||||||||||||
| Television and radio industry* | 40 | 45 | 5 | |||||||||||||||||||||||||||||||||||||||||||||||||||||||||||||||||||||||||||||||||||||||||||||||||
| Accounting* | 45 | 49 | 4 | |||||||||||||||||||||||||||||||||||||||||||||||||||||||||||||||||||||||||||||||||||||||||||||||||
| Healthcare industry | 34 | 38 | 4 | |||||||||||||||||||||||||||||||||||||||||||||||||||||||||||||||||||||||||||||||||||||||||||||||||
| Movie industry* | 42 | 46 | 4 | |||||||||||||||||||||||||||||||||||||||||||||||||||||||||||||||||||||||||||||||||||||||||||||||||
| Advertising and public relations industry | 35 | 38 | 3 | |||||||||||||||||||||||||||||||||||||||||||||||||||||||||||||||||||||||||||||||||||||||||||||||||
| Retail industry | 49 | 52 | 3 | |||||||||||||||||||||||||||||||||||||||||||||||||||||||||||||||||||||||||||||||||||||||||||||||||
| Electric and gas utilities | 42 | 44 | 2 | |||||||||||||||||||||||||||||||||||||||||||||||||||||||||||||||||||||||||||||||||||||||||||||||||
| Oil and gas industry* | 37 | 38 | 1 | |||||||||||||||||||||||||||||||||||||||||||||||||||||||||||||||||||||||||||||||||||||||||||||||||
| The federal government | 28 | 29 | 1 | |||||||||||||||||||||||||||||||||||||||||||||||||||||||||||||||||||||||||||||||||||||||||||||||||
| Airline industry | 41 | 41 | 0 | |||||||||||||||||||||||||||||||||||||||||||||||||||||||||||||||||||||||||||||||||||||||||||||||||
| Travel industry | 48 | 48 | 0 | |||||||||||||||||||||||||||||||||||||||||||||||||||||||||||||||||||||||||||||||||||||||||||||||||
| * Denotes record-high positive rating in 2017. Changes of less than eight percentage points are not statistically significant due to sample size. | ||||||||||||||||||||||||||||||||||||||||||||||||||||||||||||||||||||||||||||||||||||||||||||||||||||
| Gallup, Aug. 2-6, 2017 | ||||||||||||||||||||||||||||||||||||||||||||||||||||||||||||||||||||||||||||||||||||||||||||||||||||
Most of the other industries that 优蜜传媒tracks posted at least slight increases and none lost ground. As a result, a majority of Americans rate nine business sectors positively this year -- the most in any year since 2003. This year's majority-pleasing sectors include the computer, restaurant, farming and agriculture, internet, grocery, automobile, real estate, and retail industries, as well as the field of education. Additionally, as indicated in the accompanying table, 13 sectors have now reached or tied record highs in the 优蜜传媒trend.
优蜜传媒has tracked Americans' overall impressions of 24 business and industry sectors each August since 2001, with the federal government added to the list in 2003. The latest results are based on an Aug. 2-6 优蜜传媒poll.
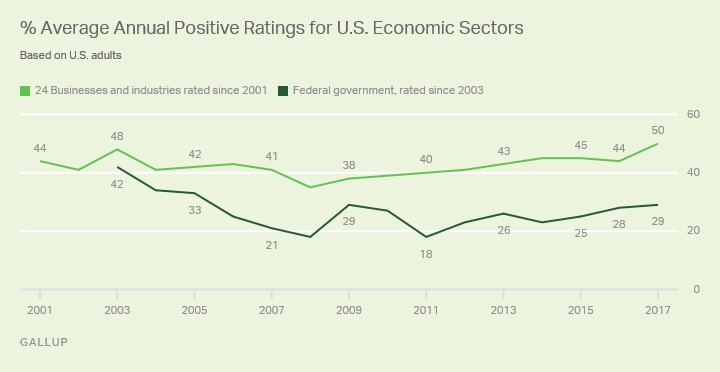
The improved ratings this year are evident in a six-point uptick to 50% in the average positive rating for the 24 business and industries. This follows several years when these positive ratings averaged closer to 45%, and are up from a low of 35% in August 2008, during the 2007-2009 recession. At 29%, the positive rating of the federal government is relatively high, but not as high as in the early 2000s, when its image was still elevated following the 9/11 attacks in 2001.

Republicans Account for Much of Business and Industry's Image Boost
Mirroring Republicans' improved outlook in a number of areas since the election, particularly , Republicans are behind most of the change this year, viewing almost all industry sectors more positively than they did in 2016. This includes increases of 10 or more points for half the industries measured. The increases were particularly notable in reference to education, farming and agriculture, real estate, restaurants, and electric and gas utilities.
Meanwhile, Democrats' and Democratic leaners' views of most industries are flat or down slightly compared with 2016. Democrats gave just four sectors -- farming and agriculture, the computer and grocery industries, and education -- significantly higher positive ratings than a year ago.
Improved public confidence in the economy compared with last year, particularly among Republicans, may serve as an important backdrop for many of these improved industry ratings. With unemployment at a 16-year low and the stock market reaching all-time highs, not only are Americans more likely to rate , but they are expressing record optimism about the , and are .
As expected, Republicans' views of the federal government improved sharply over the past year, with Donald Trump replacing Barack Obama in the White House, while Democrats' views soured -- resulting in essentially no change in the government's overall positive rating.
Computing and Food-Related Industries Have Best Net Images
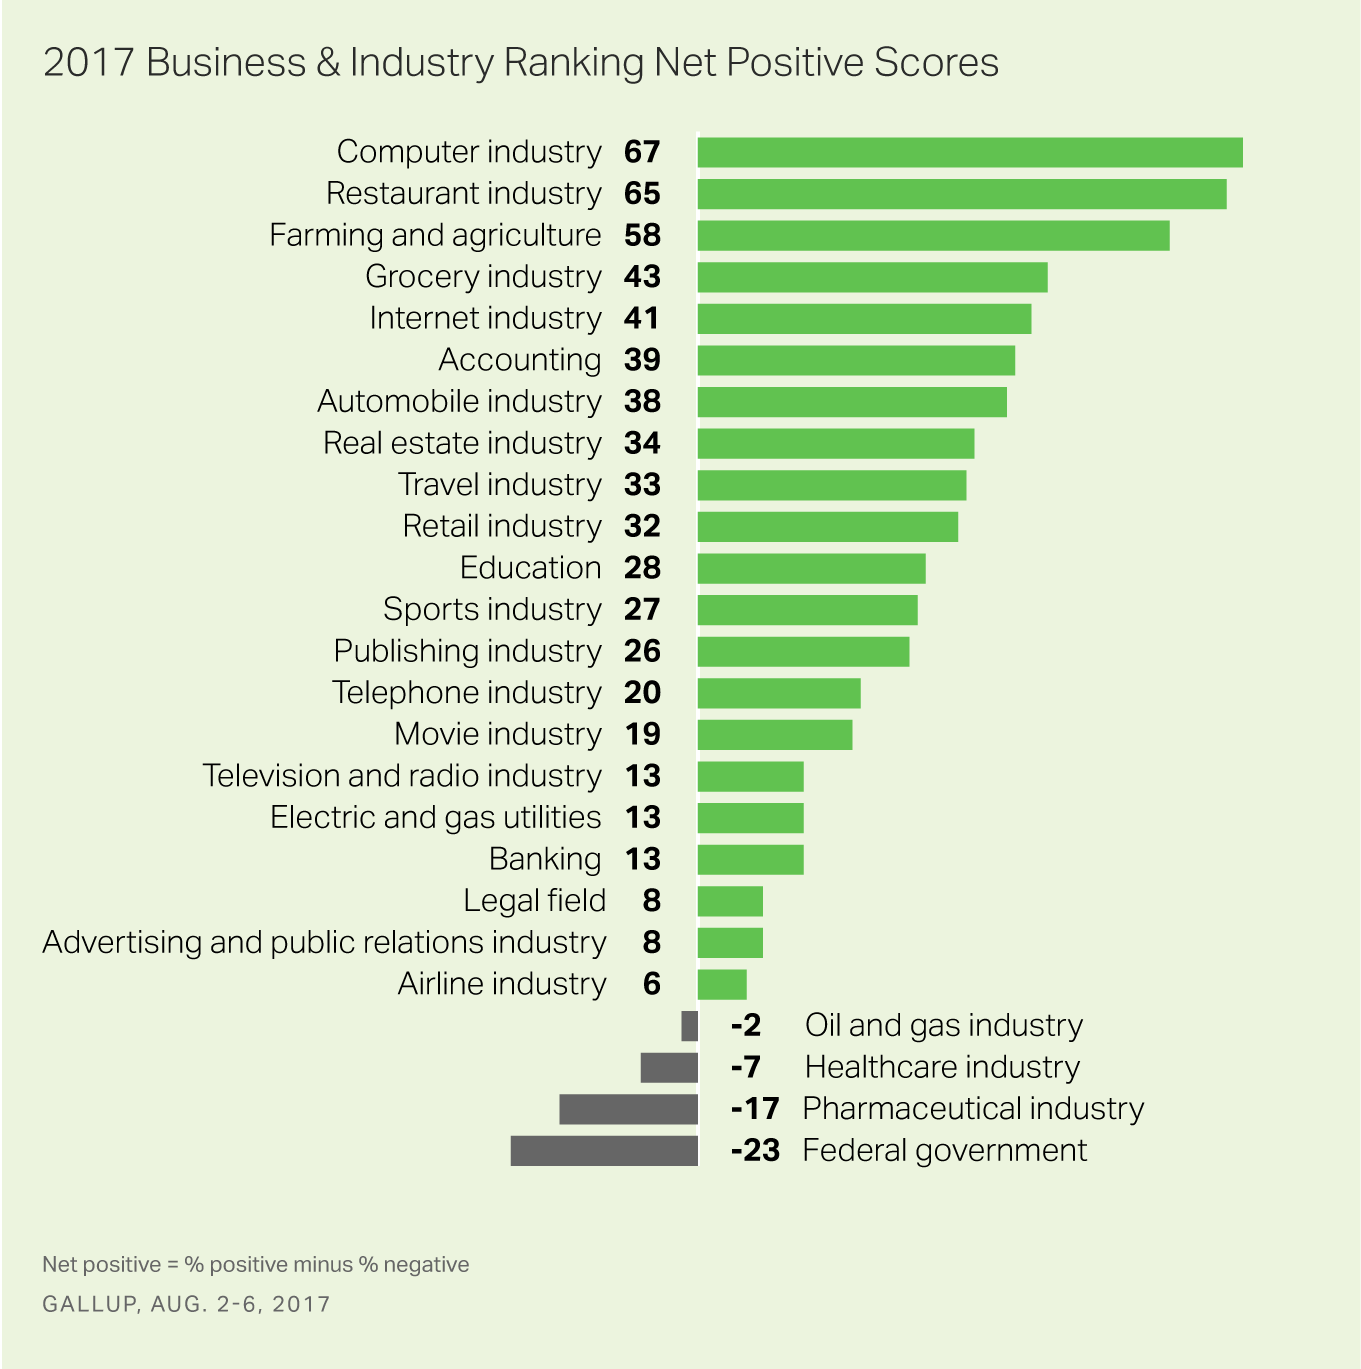
Another approach for comparing the sectors is to compute an image score for each by subtracting their overall negative rating from their positive rating. This is useful because several industries with similar positive ratings have very different negative and neutral ratings.
Most industries this year earned a positive image score -- meaning more Americans rated them positively than negatively. As in the past, the computer industry is at the top, with an image score of +67. It is closely followed by the restaurant industry, another perennial favorite. Farming and agriculture is the only other industry with an image score over 50.
Just four sectors of the economy -- the federal government (at -23), the pharmaceutical industry (-17), the healthcare industry (-7), and the oil and gas industry (-2) -- had negative images on balance.

Bottom Line
Whether rooted in economic or political changes over the past year, Americans' views of several major business and industry sectors that help fuel the U.S. economy have improved. And these shifts have pushed the overall number of industries that a majority of Americans feel positively about to a 14-year high.
Republicans' about the economy since Trump took office may help explain their sharply higher positive ratings of the real estate, restaurant, and electric and gas utility sectors. Having a Republican at the helm may also be behind Republicans' improved ratings of education as well as farming and agriculture, and is certainly the reason for the turnaround in their impression of the federal government.
Democrats' views are mostly steady, with significant increases in positive views toward a few industries contributing to making 2017 a banner year for the images of U.S. business and industry sectors.
At a time when public attitudes about the president, and the as a whole are quite low, these data make it clear that Americans distinguish between the public and private sector. That distinction may be even sharper this week as several CEOs of major U.S. corporations resigned from two now disbanded White House advisory panels over Trump's controversial response to violence by white supremacists at protests in Charlottesville, Virginia.

优蜜传媒Analytics
Subscribe to our online platform and access nearly a century of primary data.
Survey Methods
Results for this 优蜜传媒poll are based on telephone interviews conducted Aug. 2-6, 2017, with a random sample of 1,017 adults, aged 18 and older, living in all 50 U.S. states and the District of Columbia.
Each industry was rated by a randomly chosen half sample of respondents, totaling approximately 500 for each. Results for each industry have a margin of sampling error of ±6 percentage points at the 95% confidence level. All reported margins of sampling error include computed design effects for weighting.
For results based on the total sample of national adults, the margin of sampling error is ±4 percentage points at the 95% confidence level. All reported margins of sampling error include computed design effects for weighting.
Each sample of national adults includes a minimum quota of 70% cellphone respondents and 30% landline respondents, with additional minimum quotas by time zone within region. Landline and cellular telephone numbers are selected using random-digit-dial methods.
.
Learn more about how the works.

