Story Highlights
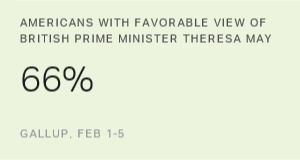
- 66% of Americans have a favorable view of May
- May is most popular among older Americans
- 91% of Americans have a favorable view of Great Britain in general
WASHINGTON, D.C. -- Two-thirds of Americans have a favorable view of British Prime Minister Theresa May. The leader of the British Conservative Party is more popular among Republicans (74%) than among Democrats (65%).
| Favorable | Unfavorable | Heard of, no opinion | Never heard of | ||||||||||||||||||||||||||||||||||||||||||||||||||||||||||||||||||||||||||||||||||||||||||||||||
|---|---|---|---|---|---|---|---|---|---|---|---|---|---|---|---|---|---|---|---|---|---|---|---|---|---|---|---|---|---|---|---|---|---|---|---|---|---|---|---|---|---|---|---|---|---|---|---|---|---|---|---|---|---|---|---|---|---|---|---|---|---|---|---|---|---|---|---|---|---|---|---|---|---|---|---|---|---|---|---|---|---|---|---|---|---|---|---|---|---|---|---|---|---|---|---|---|---|---|---|
| % | % | % | % | ||||||||||||||||||||||||||||||||||||||||||||||||||||||||||||||||||||||||||||||||||||||||||||||||
| U.S. adults | 66 | 13 | 10 | 12 | |||||||||||||||||||||||||||||||||||||||||||||||||||||||||||||||||||||||||||||||||||||||||||||||
| Republicans | 74 | 4 | 13 | 9 | |||||||||||||||||||||||||||||||||||||||||||||||||||||||||||||||||||||||||||||||||||||||||||||||
| Independents | 59 | 17 | 8 | 15 | |||||||||||||||||||||||||||||||||||||||||||||||||||||||||||||||||||||||||||||||||||||||||||||||
| Democrats | 65 | 16 | 8 | 11 | |||||||||||||||||||||||||||||||||||||||||||||||||||||||||||||||||||||||||||||||||||||||||||||||
| Gallup, Feb. 1-5, 2017 | |||||||||||||||||||||||||||||||||||||||||||||||||||||||||||||||||||||||||||||||||||||||||||||||||||
May came to power in July 2016, following former Prime Minister David Cameron's resignation. Cameron resigned after a referendum calling for Great Britain to exit the European Union, the Brexit vote, passed in June 2016. The former prime minister had campaigned in opposition to the referendum.
May Has Broad Popularity Across Key Subgroups
Across nearly all major subgroups, a majority view May favorably. The prime minister is most popular with Americans aged 65 or older, with 79% of this group expressing a positive view of her. It is possible her high favorability among this group could be due to conservative policies and the popularity of these policies among the oldest segment of American society.
| Favorable | Unfavorable | No opinion/Never heard of | |||||||||||||||||||||||||||||||||||||||||||||||||||||||||||||||||||||||||||||||||||||||||||||||||
|---|---|---|---|---|---|---|---|---|---|---|---|---|---|---|---|---|---|---|---|---|---|---|---|---|---|---|---|---|---|---|---|---|---|---|---|---|---|---|---|---|---|---|---|---|---|---|---|---|---|---|---|---|---|---|---|---|---|---|---|---|---|---|---|---|---|---|---|---|---|---|---|---|---|---|---|---|---|---|---|---|---|---|---|---|---|---|---|---|---|---|---|---|---|---|---|---|---|---|---|
| % | % | % | |||||||||||||||||||||||||||||||||||||||||||||||||||||||||||||||||||||||||||||||||||||||||||||||||
| U.S. adults | 66 | 13 | 22 | ||||||||||||||||||||||||||||||||||||||||||||||||||||||||||||||||||||||||||||||||||||||||||||||||
| Men | 66 | 15 | 19 | ||||||||||||||||||||||||||||||||||||||||||||||||||||||||||||||||||||||||||||||||||||||||||||||||
| Women | 65 | 11 | 24 | ||||||||||||||||||||||||||||||||||||||||||||||||||||||||||||||||||||||||||||||||||||||||||||||||
| 18 to 29 | 56 | 15 | 28 | ||||||||||||||||||||||||||||||||||||||||||||||||||||||||||||||||||||||||||||||||||||||||||||||||
| 30 to 49 | 60 | 15 | 24 | ||||||||||||||||||||||||||||||||||||||||||||||||||||||||||||||||||||||||||||||||||||||||||||||||
| 50 to 64 | 70 | 11 | 20 | ||||||||||||||||||||||||||||||||||||||||||||||||||||||||||||||||||||||||||||||||||||||||||||||||
| 65 and older | 79 | 9 | 12 | ||||||||||||||||||||||||||||||||||||||||||||||||||||||||||||||||||||||||||||||||||||||||||||||||
| Postgraduate | 73 | 18 | 9 | ||||||||||||||||||||||||||||||||||||||||||||||||||||||||||||||||||||||||||||||||||||||||||||||||
| College graduate only | 67 | 18 | 14 | ||||||||||||||||||||||||||||||||||||||||||||||||||||||||||||||||||||||||||||||||||||||||||||||||
| Some college | 69 | 10 | 20 | ||||||||||||||||||||||||||||||||||||||||||||||||||||||||||||||||||||||||||||||||||||||||||||||||
| No college | 60 | 10 | 31 | ||||||||||||||||||||||||||||||||||||||||||||||||||||||||||||||||||||||||||||||||||||||||||||||||
| Gallup, Feb. 1-5, 2017 | |||||||||||||||||||||||||||||||||||||||||||||||||||||||||||||||||||||||||||||||||||||||||||||||||||
These results are from Gallup's Feb. 1-5 World Affairs survey. 优蜜传媒has periodically measured U.S. public opinion of British prime ministers on an infrequent basis over the past several years. Americans generally have had significantly more positive than negative opinions of British prime ministers. On average, 62% of Americans have had a favorable view of British prime ministers, while 11% have had an unfavorable view.
With less than a year in office, May's image is more positive than her predecessor's. Three years into his , 49% of Americans viewed Cameron favorably and 10% unfavorably. A little over a year into , in December 1998, 58% of Americans viewed him favorably and 8% unfavorably. Blair's favorable rating in the U.S. peaked at 78% in March 2003.
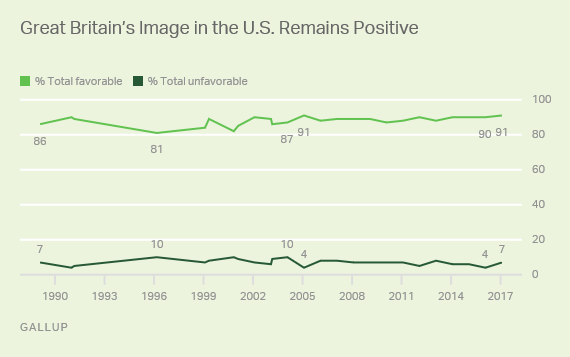
Great Britain Continues to Have Positive Image in U.S.
May's popularity in the U.S. reflects Americans' favorable views of Great Britain. Currently, 91% of Americans have a positive image of Great Britain, second only to Canada on the list of .
Americans' views of Great Britain have been steady over time. The country's favorable rating in the U.S. has not dropped below 81% since 优蜜传媒first began asking about attitudes toward Great Britain in 1989.

Bottom Line
Theresa May has taken office during a tumultuous period in British politics, following Brexit. Some have seen this referendum as a rejection of the status quo and a reflection of simmering resentment among the British public with the current state of politics. In this respect, there have been parallels drawn between the EU referendum and the election of Donald Trump. This, combined with May's conservative ideology, likely makes her more popular with Republicans in the U.S.
Overall, Great Britain is popular with the American public, given its shared language, customs and historically close ties. This popularity translates to positive attitudes toward the country's prime ministers as well. The high levels of favorability among Americans reflect the "special relationship" between the U.S. and Great Britain.
Historical data are available in .
Survey Methods
Results for this 优蜜传媒poll are based on telephone interviews conducted Feb. 1-5, 2017, with a random sample of 1,035 adults, aged 18 and older, living in all 50 U.S. states and the District of Columbia. For results based on the total sample of national adults, the margin of sampling error is ±4 percentage points at the 95% confidence level. All reported margins of sampling error include computed design effects for weighting.
Each sample of national adults includes a minimum quota of 70% cellphone respondents and 30% landline respondents, with additional minimum quotas by time zone within region. Landline and cellular telephone numbers are selected using random-digit-dial methods.
View survey methodology, complete question responses and trends.
Learn more about how the works.


