Story Highlights
- 56% say they are satisfied with total cost they pay for healthcare
- 33% rate U.S. healthcare coverage as "excellent" or "good"
- Most Americans say the quality of healthcare nationwide is excellent or good
WASHINGTON, D.C. -- Americans are more likely to be positive about the cost, coverage and quality of their own healthcare than they are about the same aspects of healthcare nationwide. For both their own healthcare and healthcare nationally, they are most positive about quality and least positive about cost, with coverage falling in the middle.
| Own care | Healthcare nationally | ||||||||||||||||||||||||||||||||||||||||||||||||||||||||||||||||||||||||||||||||||||||||||||||||||
|---|---|---|---|---|---|---|---|---|---|---|---|---|---|---|---|---|---|---|---|---|---|---|---|---|---|---|---|---|---|---|---|---|---|---|---|---|---|---|---|---|---|---|---|---|---|---|---|---|---|---|---|---|---|---|---|---|---|---|---|---|---|---|---|---|---|---|---|---|---|---|---|---|---|---|---|---|---|---|---|---|---|---|---|---|---|---|---|---|---|---|---|---|---|---|---|---|---|---|---|
| % | % | ||||||||||||||||||||||||||||||||||||||||||||||||||||||||||||||||||||||||||||||||||||||||||||||||||
| Rate quality excellent/good | 76 | 55 | |||||||||||||||||||||||||||||||||||||||||||||||||||||||||||||||||||||||||||||||||||||||||||||||||
| Rate coverage excellent/good | 65 | 33 | |||||||||||||||||||||||||||||||||||||||||||||||||||||||||||||||||||||||||||||||||||||||||||||||||
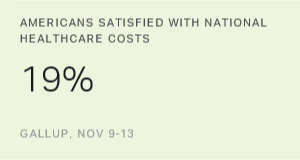
| Satisfied with cost | 56 | 19 | |||||||||||||||||||||||||||||||||||||||||||||||||||||||||||||||||||||||||||||||||||||||||||||||||
| Nov. 9-13, 2016 | |||||||||||||||||||||||||||||||||||||||||||||||||||||||||||||||||||||||||||||||||||||||||||||||||||
| Gallup | |||||||||||||||||||||||||||||||||||||||||||||||||||||||||||||||||||||||||||||||||||||||||||||||||||
These results are based on Gallup's annual Healthcare poll, conducted Nov. 9-13. The current patterns -- that Americans are more positive about their own healthcare than about healthcare nationally, rate quality better than coverage and rate coverage better than cost -- have been consistent in Gallup's polling since 2001. Currently, the personal versus national gaps in positive ratings are smallest in terms of quality (21 percentage points) and largest on cost (37 points).
Americans More Positive About Quality of Own Care Than Quality Nationally
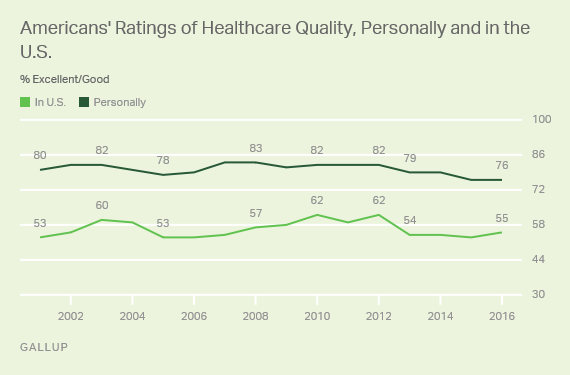
Since 2001, Americans have been quite positive about the quality of the healthcare they personally receive. This year, 76% rate the quality of their healthcare as excellent or good, just a bit lower than the peak of 83% in 2007 and 2008. However, fewer Americans -- although still a majority -- are positive about healthcare quality in the U.S. In 2016, 55% say they are satisfied, down from a high of 62% in 2010 and 2012.
Americans Generally Satisfied With Their Own Healthcare Coverage
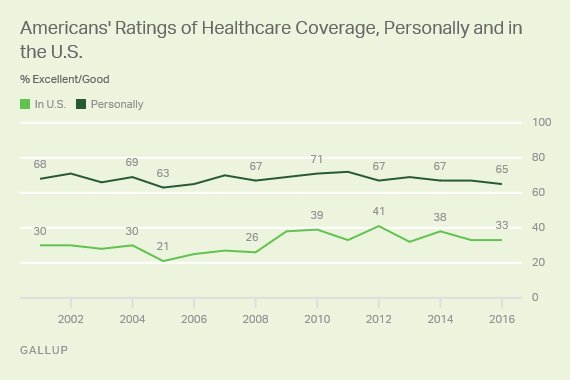
Sixty-five percent of Americans rate their own healthcare coverage as "excellent" or "good." This personal satisfaction has been roughly constant over the past 15 years, including after the Affordable Care Act was enacted in 2010 and the healthcare exchanges first opened in 2014.
While 65% of Americans rate their personal healthcare coverage positively, about half as many say healthcare coverage nationwide is excellent or good.
Americans' ratings of healthcare coverage nationally have improved modestly from the past decade. In 2005, 21% rated U.S. healthcare coverage excellent or good, and this rose to 26% in 2008. In 2009, before Obamacare became law but before it was fully implemented in 2014, ratings of healthcare coverage in the U.S. spiked, reaching 39% in 2010 and 41% in 2012 before dipping back down over the past several years.
Americans Aren't as Satisfied With National Healthcare Costs
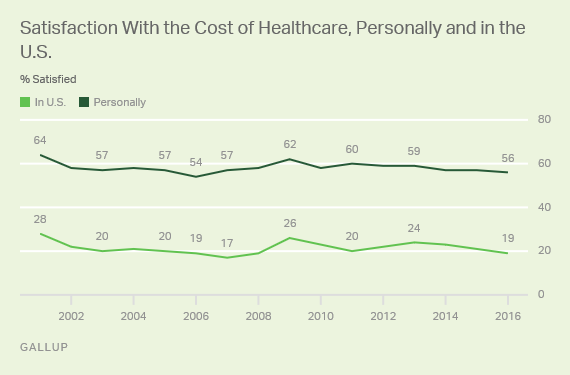
Americans are less satisfied with the cost of their healthcare than with their healthcare quality or coverage. This year, 56% say they are satisfied with the total cost they pay for healthcare, a figure that has been relatively stable over the past 15 years. It is down from a high point of 64% in 2001 and from 62% in 2009, the year before the ACA was signed into law. In 2006, 54% of Americans said they were satisfied with their healthcare costs, the low point in Gallup's trend.
While a majority of Americans say they are satisfied with their healthcare costs, few (19%) are satisfied with healthcare costs nationally. Satisfaction with nationwide costs rose to 26% in 2009, President Barack Obama's first year in office, but that uptick was not sustained. The 19% satisfied this year is within two points of the lowest 优蜜传媒has measured.
Bottom Line
Americans are more content with their own healthcare coverage, quality and costs than they are with those same aspects for Americans nationwide. This local versus national divergence is similar to how Americans rate , and .
Americans generally believe healthcare in the U.S. is high quality, though they widely believe such care is too costly. More money is spent in the U.S. on healthcare than in any other nation.
Obamacare will remain a central point of debate in the near term. Premium increases for the ACA next year may be affecting Americans' perceptions of healthcare costs nationwide, and there is fresh talk of repeal now that Donald Trump has been elected president and will have a GOP Congress to work with. Republicans in Congress have talked about "repealing and replacing" Obamacare since the law went into effect, and this discourse may still be influencing Americans' perceptions of the law. With this as a front-burner issue in Washington, it will be interesting to see if one year from now there is a significant shift in U.S. healthcare policy, and in Americans' perceptions on these questions.
Historical data are available in .
Survey Methods
Results for this 优蜜传媒poll are based on telephone interviews conducted Nov. 9-13, 2016, with a random sample of 1,019 adults, aged 18 and older, living in all 50 U.S. states and the District of Columbia. For results based on the total sample of national adults, the margin of sampling error is ±4 percentage points at the 95% confidence level. All reported margins of sampling error include computed design effects for weighting.
Each sample of national adults includes a minimum quota of 60% cellphone respondents and 40% landline respondents, with additional minimum quotas by time zone within region. Landline and cellular telephone numbers are selected using random-digit-dial methods.
View survey methodology, complete question responses and trends.
Learn more about how the works.
