Story Highlights
- Current stable period contrasts with more volatile first half of the year
- Current conditions component at -2; economic outlook at -21
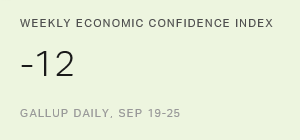
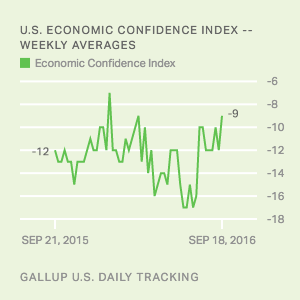
WASHINGTON, D.C. -- Gallup's U.S. Economic Confidence Index was -12 last week, marking the ninth consecutive week that confidence has been no lower than -12 and no higher than -9. Before this spell of stability, the index fell unevenly from -7 in mid-January to -17 in June and July before edging up to the current level.
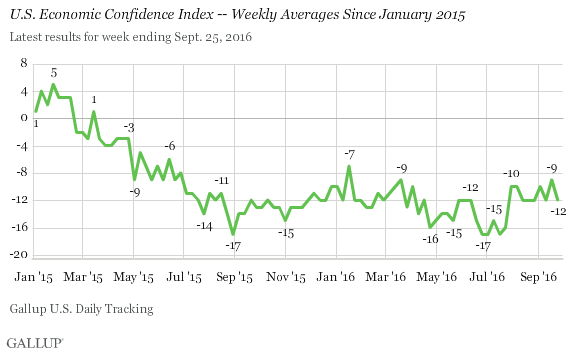
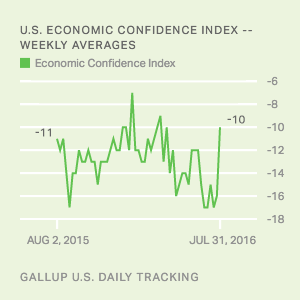
Though the index remains below its January 2015 post-recession peak of +5, it has at least lingered at the higher level it attained since the last week of July. The index climbed six points to -10 that week due to increased confidence among Democrats after the July 25-28 Democratic National Convention.
The trajectory of economic confidence this year more closely resembles its trend during the 2012 presidential election, when the incumbent party held on to the White House, than during the 2008 election, when the presidency changed hands. Similar to this year, the index significantly improved in 2012 after the incumbent party's nominating convention, rising from -29 to -18 in early September. After that boost, it remained stable for several weeks (much like this year) before climbing even higher in mid-October to rest at -10 on the eve of Barack Obama's re-election.
By contrast, Gallup's U.S. Economic Confidence Index was in free fall in late September 2008 as financial markets roiled. During this period, economic confidence fell 21 points from -39 in the first week of September to -60 in the final full week of the month. The index failed to make any meaningful improvement ahead of the November election and stood at -55 as Americans went to the polls.
Gallup's U.S. Economic Confidence Index is the average of two components: how Americans rate current economic conditions and whether they feel the economy is improving or getting worse. The index has a theoretical maximum of +100 if all Americans say the economy is doing well and improving, and a theoretical minimum of -100 if all Americans say the economy is doing poorly and getting worse.
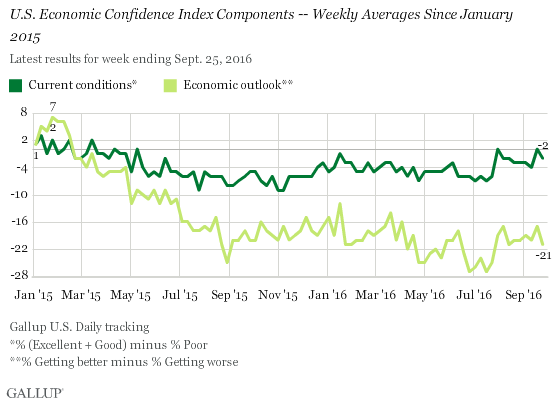
Last week, nearly three in 10 Americans (27%) described U.S. economic conditions as "excellent" or "good," while 29% said they were "poor," resulting in a current conditions score of -2. This component stood at 0 one week earlier.
Thirty-seven percent of Americans last week said economic conditions in the country were "getting better," essentially unchanged from the 39% who said so the week before. Conversely, 58% of Americans said economic conditions were "getting worse," similar to the 56% who said so the week before. For the week ending Sept. 25, the economic outlook score stood at -21.
Bottom Line
After a bumpy first half of 2016, Gallup's U.S. Economic Confidence Index has experienced its eighth straight week of no statistically significant change. Last week's decision by the Federal Reserve to make no changes to its interest rate policies may have averted one potential source of disruption for the economy and economic perceptions.
As the election draws near, it is worth considering in what ways U.S. economic confidence might influence the outcome of the contest. Certainly, the stability of Americans' economic confidence at the least does not spell clear trouble for Hillary Clinton's campaign in the same way that plummeting confidence likely did for John McCain's bid to keep the White House in Republican hands. At the same time, the current performance of Gallup's U.S. Economic Confidence Index has not yet shown the same sizable improvement the index underwent over the course of the 2012 general election -- from -29 in late August to -10 just before Election Day. And, as former secretary of state, Clinton has less standing to claim credit for an improving economy than Obama did in 2012.
For now, Americans' outlook on the economy appears neither strong enough to greatly advantage the incumbent party nor weak enough to significantly harm it. The lack of such a clear-cut economic landscape may be one reason there is so much attention on the day-to-day events of the campaign and events such as Monday's .
Survey Methods
Results for this 优蜜传媒poll are based on telephone interviews conducted Sept. 19-25, 2016, on the 优蜜传媒U.S. Daily survey, with a random sample of 3,554 adults, aged 18 and older, living in all 50 U.S. states and the District of Columbia. For results based on the total sample of national adults, the margin of sampling error is ±2 percentage points at the 95% confidence level. All reported margins of sampling error include computed design effects for weighting.
Each sample of national adults includes a minimum quota of 60% cellphone respondents and 40% landline respondents, with additional minimum quotas by time zone within region. Landline and cellular telephone numbers are selected using random-digit-dial methods.
Learn more about how the works.
