Story Highlights
- Hawaii again leads U.S. in well-being among older residents
- West Virginia's older residents have lowest well-being
- Hawaii, Arizona among top five states in three well-being elements
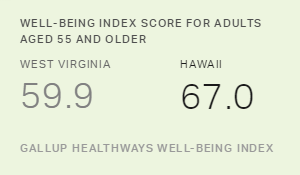
WASHINGTON, D.C. -- For the second consecutive year, Hawaii led all U.S. states in well-being among residents aged 55 and over, with a Well-Being Index score of 67.0. The other four states with a Well-Being Index score of 65 or higher are Arizona, New Hampshire, North Dakota and Colorado. West Virginia, Kentucky, Oklahoma, Ohio and Indiana are the states with the lowest well-being among older residents, unchanged from last year.
| State | Well-Being Index Score | State | Well-Being Index Score | ||||||||||||||||||||||||||||||||||||||||||||||||||||||||||||||||||||||||||||||||||||||||||||||||
|---|---|---|---|---|---|---|---|---|---|---|---|---|---|---|---|---|---|---|---|---|---|---|---|---|---|---|---|---|---|---|---|---|---|---|---|---|---|---|---|---|---|---|---|---|---|---|---|---|---|---|---|---|---|---|---|---|---|---|---|---|---|---|---|---|---|---|---|---|---|---|---|---|---|---|---|---|---|---|---|---|---|---|---|---|---|---|---|---|---|---|---|---|---|---|---|---|---|---|---|
| Hawaii | 67.0 | West Virginia | 59.9 | ||||||||||||||||||||||||||||||||||||||||||||||||||||||||||||||||||||||||||||||||||||||||||||||||
| Arizona | 65.2 | Kentucky | 61.2 | ||||||||||||||||||||||||||||||||||||||||||||||||||||||||||||||||||||||||||||||||||||||||||||||||
| New Hampshire | 65.2 | Oklahoma | 62.0 | ||||||||||||||||||||||||||||||||||||||||||||||||||||||||||||||||||||||||||||||||||||||||||||||||
| North Dakota | 65.2 | Ohio | 62.5 | ||||||||||||||||||||||||||||||||||||||||||||||||||||||||||||||||||||||||||||||||||||||||||||||||
| Colorado | 65.1 | Indiana | 62.7 | ||||||||||||||||||||||||||||||||||||||||||||||||||||||||||||||||||||||||||||||||||||||||||||||||
| Alaska | 64.9 | Vermont | 62.7 | ||||||||||||||||||||||||||||||||||||||||||||||||||||||||||||||||||||||||||||||||||||||||||||||||
| Minnesota | 64.9 | Georgia | 62.9 | ||||||||||||||||||||||||||||||||||||||||||||||||||||||||||||||||||||||||||||||||||||||||||||||||
| Wisconsin | 64.9 | Missouri | 62.9 | ||||||||||||||||||||||||||||||||||||||||||||||||||||||||||||||||||||||||||||||||||||||||||||||||
| Iowa | 64.7 | Arkansas | 62.9 | ||||||||||||||||||||||||||||||||||||||||||||||||||||||||||||||||||||||||||||||||||||||||||||||||
| South Dakota | 64.7 | New Jersey | 62.9 | ||||||||||||||||||||||||||||||||||||||||||||||||||||||||||||||||||||||||||||||||||||||||||||||||
| Gallup-Healthways Well-Being Index, Q1 2015 through Q1 2016 | |||||||||||||||||||||||||||||||||||||||||||||||||||||||||||||||||||||||||||||||||||||||||||||||||||
These state-level data are based on more than 115,000 interviews with U.S. adults across all 50 states, conducted from Jan. 2, 2015, through March 31, 2016. The Well-Being Index is calculated on a scale of 0 to 100, where 0 represents the lowest possible well-being and 100 represents the highest possible well-being. The scores for the nation and for each state consist of metrics affecting overall well-being and each of the five essential elements of well-being:
- Purpose: liking what you do each day and being motivated to achieve your goals
- Social: having supportive relationships and love in your life
- Financial: managing your economic life to reduce stress and increase security
- Community: liking where you live, feeling safe and having pride in your community
- Physical: having good health and enough energy to get things done daily
In most cases, a difference of 1.0 point in the Well-Being Index score between any two states represents a statistically significant gap.
Hawaii Leads All States in Three Elements of Well-Being
Hawaii holds the highest well-being of older residents in three of the five elements: purpose, community and physical well-being. Older residents of Arizona, South Carolina and Florida report the highest social well-being, while those living in North Dakota, Iowa and Minnesota lead in financial well-being. Across the five elements, Hawaii and Arizona each rank among the top five states three times, while Iowa, New Hampshire and North Dakota each appear twice.
West Virginia's older residents report the lowest purpose, social and physical well-being, and rank among the five states with the lowest well-being in all five elements. Older residents of Mississippi, Georgia and Louisiana have the lowest financial well-being, while those living in New Jersey, West Virginia and Maryland report the lowest community well-being.
| Purpose | Social | Financial | Community | Physical | |||||||||||||||||||||||||||||||||||||||||||||||||||||||||||||||||||||||||||||||||||||||||||||||
|---|---|---|---|---|---|---|---|---|---|---|---|---|---|---|---|---|---|---|---|---|---|---|---|---|---|---|---|---|---|---|---|---|---|---|---|---|---|---|---|---|---|---|---|---|---|---|---|---|---|---|---|---|---|---|---|---|---|---|---|---|---|---|---|---|---|---|---|---|---|---|---|---|---|---|---|---|---|---|---|---|---|---|---|---|---|---|---|---|---|---|---|---|---|---|---|---|---|---|---|
| Hawaii | Arizona | North Dakota | Hawaii | Hawaii | |||||||||||||||||||||||||||||||||||||||||||||||||||||||||||||||||||||||||||||||||||||||||||||||
| Mississippi | South Carolina | Iowa | Montana | Colorado | |||||||||||||||||||||||||||||||||||||||||||||||||||||||||||||||||||||||||||||||||||||||||||||||
| Texas | Florida | Minnesota | North Dakota | New Hampshire | |||||||||||||||||||||||||||||||||||||||||||||||||||||||||||||||||||||||||||||||||||||||||||||||
| Arizona | New Hampshire | Alaska | South Dakota | Connecticut | |||||||||||||||||||||||||||||||||||||||||||||||||||||||||||||||||||||||||||||||||||||||||||||||
| Alabama | Maryland | Wisconsin | Iowa | Arizona | |||||||||||||||||||||||||||||||||||||||||||||||||||||||||||||||||||||||||||||||||||||||||||||||
| Purpose | Social | Financial | Community | Physical | |||||||||||||||||||||||||||||||||||||||||||||||||||||||||||||||||||||||||||||||||||||||||||||||
|---|---|---|---|---|---|---|---|---|---|---|---|---|---|---|---|---|---|---|---|---|---|---|---|---|---|---|---|---|---|---|---|---|---|---|---|---|---|---|---|---|---|---|---|---|---|---|---|---|---|---|---|---|---|---|---|---|---|---|---|---|---|---|---|---|---|---|---|---|---|---|---|---|---|---|---|---|---|---|---|---|---|---|---|---|---|---|---|---|---|---|---|---|---|---|---|---|---|---|---|
| West Virginia | West Virginia | Mississippi | New Jersey | West Virginia | |||||||||||||||||||||||||||||||||||||||||||||||||||||||||||||||||||||||||||||||||||||||||||||||
| Vermont | Wyoming | Georgia | West Virginia | Kentucky | |||||||||||||||||||||||||||||||||||||||||||||||||||||||||||||||||||||||||||||||||||||||||||||||
| Kentucky | Vermont | Louisiana | Maryland | Oklahoma | |||||||||||||||||||||||||||||||||||||||||||||||||||||||||||||||||||||||||||||||||||||||||||||||
| Massachusetts | Montana | South Carolina | Illinois | Arkansas | |||||||||||||||||||||||||||||||||||||||||||||||||||||||||||||||||||||||||||||||||||||||||||||||
| New Jersey | Kentucky | West Virginia | Connecticut | Tennessee | |||||||||||||||||||||||||||||||||||||||||||||||||||||||||||||||||||||||||||||||||||||||||||||||
| Gallup-Healthways Well-Being Index, Q1 2015 through Q1 2016 | |||||||||||||||||||||||||||||||||||||||||||||||||||||||||||||||||||||||||||||||||||||||||||||||||||
Older Residents of New Hampshire Have Largest Well-Being Advantage
New Hampshire's older residents have the largest well-being advantage compared with the general population of the state, with residents aged 55 or older having a Well-Being Index score of 65.2 compared with 62.1 for residents overall -- a difference of 3.1 points. For comparison, older adults in the U.S. generally have higher well-being compared with the broader adult population, with an average gap of 1.7 points. The well-being edge for New Hampshire's older residents significantly boosts its state ranking from 21st for the overall population to the third-highest among residents aged 55 and older. Three other states with notably higher well-being among older residents compared with the general population are North Dakota, Mississippi and Oregon.
| Well-Being Index Score | Well-Being Index Score | Difference | |||||||||||||||||||||||||||||||||||||||||||||||||||||||||||||||||||||||||||||||||||||||||||||||||
|---|---|---|---|---|---|---|---|---|---|---|---|---|---|---|---|---|---|---|---|---|---|---|---|---|---|---|---|---|---|---|---|---|---|---|---|---|---|---|---|---|---|---|---|---|---|---|---|---|---|---|---|---|---|---|---|---|---|---|---|---|---|---|---|---|---|---|---|---|---|---|---|---|---|---|---|---|---|---|---|---|---|---|---|---|---|---|---|---|---|---|---|---|---|---|---|---|---|---|---|
| All adults | 55 and older | ||||||||||||||||||||||||||||||||||||||||||||||||||||||||||||||||||||||||||||||||||||||||||||||||||
| New Hampshire | 62.1 | 65.2 | 3.1 | ||||||||||||||||||||||||||||||||||||||||||||||||||||||||||||||||||||||||||||||||||||||||||||||||
| North Dakota | 62.3 | 65.2 | 2.9 | ||||||||||||||||||||||||||||||||||||||||||||||||||||||||||||||||||||||||||||||||||||||||||||||||
| Mississippi | 60.9 | 63.8 | 2.9 | ||||||||||||||||||||||||||||||||||||||||||||||||||||||||||||||||||||||||||||||||||||||||||||||||
| Oregon | 61.7 | 64.3 | 2.6 | ||||||||||||||||||||||||||||||||||||||||||||||||||||||||||||||||||||||||||||||||||||||||||||||||
| GALLUP-HEALTHWAYS WELL-BEING INDEX, Q1 2015 THROUGH Q1 2016 | |||||||||||||||||||||||||||||||||||||||||||||||||||||||||||||||||||||||||||||||||||||||||||||||||||
The older residents in four states have a much smaller advantage or no advantage in well-being compared with the overall population: Wyoming, Montana, Utah and Alaska. In each of these states, the Well-Being Index score among older residents is the same as or only slightly higher than the score found among all adults in the state.
| Well-Being Index Score | Well-Being Index Score | Difference | |||||||||||||||||||||||||||||||||||||||||||||||||||||||||||||||||||||||||||||||||||||||||||||||||
|---|---|---|---|---|---|---|---|---|---|---|---|---|---|---|---|---|---|---|---|---|---|---|---|---|---|---|---|---|---|---|---|---|---|---|---|---|---|---|---|---|---|---|---|---|---|---|---|---|---|---|---|---|---|---|---|---|---|---|---|---|---|---|---|---|---|---|---|---|---|---|---|---|---|---|---|---|---|---|---|---|---|---|---|---|---|---|---|---|---|---|---|---|---|---|---|---|---|---|---|
| All adults | 55 and older | ||||||||||||||||||||||||||||||||||||||||||||||||||||||||||||||||||||||||||||||||||||||||||||||||||
| Wyoming | 63.5 | 63.5 | 0.0 | ||||||||||||||||||||||||||||||||||||||||||||||||||||||||||||||||||||||||||||||||||||||||||||||||
| Montana | 63.8 | 64.2 | 0.4 | ||||||||||||||||||||||||||||||||||||||||||||||||||||||||||||||||||||||||||||||||||||||||||||||||
| Utah | 63.1 | 63.8 | 0.7 | ||||||||||||||||||||||||||||||||||||||||||||||||||||||||||||||||||||||||||||||||||||||||||||||||
| Alaska | 64.1 | 64.9 | 0.8 | ||||||||||||||||||||||||||||||||||||||||||||||||||||||||||||||||||||||||||||||||||||||||||||||||
| Gallup-Healthways Well-Being Index, Q1 2015 through Q1 2016 | |||||||||||||||||||||||||||||||||||||||||||||||||||||||||||||||||||||||||||||||||||||||||||||||||||
Each of these four states ranked in the . So while there is not a large jump in well-being among older residents, the high well-being found among the general adult population is preserved. These results suggest that one common characteristic of the nation's states with the highest well-being is high well-being across age groups rather than just among those who are older, underscoring a broader and deeper culture of well-being that might not be present elsewhere.
Implications
Americans aged 55 and over have including better eating habits, significantly reduced money worries and greater pride in their community compared with those between the ages of 18 and 54.
This elevated state of well-being upon reaching older age manifests itself in many other ways:
- Older Americans .
- Daily emotions such as happiness, worry and stress , although this is .
- Smoking rates among older Americans.
- Financial well-being , although .
- The rate of those aged 65 and older .
"People in the United States are now living significantly longer than prior generations, a trend that stands to continue," said Joe Coughlin, founder and director of the Massachusetts Institute of Technology AgeLab. "As a nation, we must improve upon advances in well-being while developing new strategies to help Americans age well and thrive in later life."
Prior research has demonstrated that high well-being among individuals is closely linked to lower healthcare costs and increased productivity. As the , boosting well-being for older Americans who remain in the workforce should be a critical goal for U.S. employers.
"Our research paints a powerful picture of how we age as a population, and the important link between the physical and social aspects of well-being, especially for older Americans," said Dr. Sheri Pruitt, Ph.D., vice president and chief behavioral scientist at Healthways. "When older adults thrive, they are more active, assert good physical and mental health, and achieve higher life satisfaction."
These data are available in .
For the complete state well-being rankings for older Americans, read the .
Survey Methods
Results are based on telephone interviews conducted Jan. 2, 2015, to March 31, 2016, as part of the Gallup-Healthways Well-Being Index survey, with a random sample of 115,572 adults, aged 55 and older, living in all 50 U.S. states and the District of Columbia. The margin of sampling error for most states is about ±1.5 points, although this increases to about ±2.1 points for the smallest-population states such as North Dakota, Wyoming, Hawaii and Delaware.
All reported margins of sampling error include computed design effects for weighting.
Learn more about how the works.


