Story Highlights
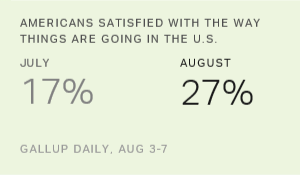
- Satisfaction now at 27%, up from 17% in July
- Democrats, independents fuel rebound in satisfaction
- Economy now most important problem in U.S.; racism drops from top spot
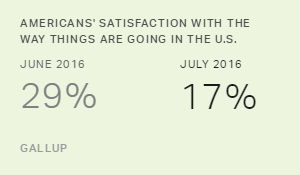
WASHINGTON, D.C. -- Americans' satisfaction with the way things are going in the U.S. rebounded this month, as national news coverage shifted away from several race-related controversies that occurred in early July. Twenty-seven percent of Americans are now satisfied with the state of affairs in the U.S., up sharply from 17% in July but similar to the level from February through June.
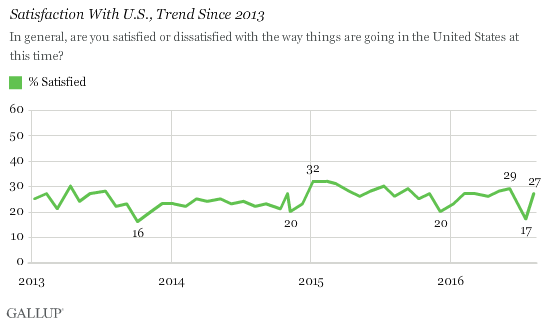
The 17% satisfied in July was the lowest satisfaction had been since October 2013, which came during a federal government shutdown. There have been two more recent low points of 20% satisfaction, in November 2014 and December 2015.
The latest data are from Gallup's monthly update of Americans' satisfaction, collected Aug. 3-7. The rebound in U.S. satisfaction comes at the same time that public concern about the issue that seemed responsible for low satisfaction in July -- race relations -- has subsided. Since the prior reading in mid-July, the U.S. has not experienced the level of disturbing incidents that made news in early July, namely, race-related shootings by police in Louisiana and Minnesota or against police officers in Dallas.
Last month, these incidents seemed to directly affect Americans' perceptions of the most important U.S. problem, with a sharp increase in the percentage naming race relations or racism. In August, race relations dropped from its No. 1 spot as most important, with mentions of it falling from 18% in July to 7% now. At the same time, mentions of the economy rose five percentage points to 17%.
These changes likely reflect a shift in the media's focus from race-related news events in early July to the national party conventions in mid- to late July.
| August 2016 | July 2016 | June 2016 | May 2016 | ||||||||||||||||||||||||||||||||||||||||||||||||||||||||||||||||||||||||||||||||||||||||||||||||
|---|---|---|---|---|---|---|---|---|---|---|---|---|---|---|---|---|---|---|---|---|---|---|---|---|---|---|---|---|---|---|---|---|---|---|---|---|---|---|---|---|---|---|---|---|---|---|---|---|---|---|---|---|---|---|---|---|---|---|---|---|---|---|---|---|---|---|---|---|---|---|---|---|---|---|---|---|---|---|---|---|---|---|---|---|---|---|---|---|---|---|---|---|---|---|---|---|---|---|---|
| % | % | % | % | ||||||||||||||||||||||||||||||||||||||||||||||||||||||||||||||||||||||||||||||||||||||||||||||||
| Economy in general | 17 | 12 | 18 | 18 | |||||||||||||||||||||||||||||||||||||||||||||||||||||||||||||||||||||||||||||||||||||||||||||||
| Dissatisfaction with government | 13 | 16 | 13 | 13 | |||||||||||||||||||||||||||||||||||||||||||||||||||||||||||||||||||||||||||||||||||||||||||||||
| Terrorism | 9 | 5 | 4 | 4 | |||||||||||||||||||||||||||||||||||||||||||||||||||||||||||||||||||||||||||||||||||||||||||||||
| Unemployment/Jobs | 8 | 7 | 8 | 9 | |||||||||||||||||||||||||||||||||||||||||||||||||||||||||||||||||||||||||||||||||||||||||||||||
| Immigration/Illegal aliens | 8 | 6 | 7 | 7 | |||||||||||||||||||||||||||||||||||||||||||||||||||||||||||||||||||||||||||||||||||||||||||||||
| National security | 7 | 6 | 5 | 4 | |||||||||||||||||||||||||||||||||||||||||||||||||||||||||||||||||||||||||||||||||||||||||||||||
| Elections/Election reform | 7 | 5 | 6 | 5 | |||||||||||||||||||||||||||||||||||||||||||||||||||||||||||||||||||||||||||||||||||||||||||||||
| Race relations/Racism | 7 | 18 | 5 | 5 | |||||||||||||||||||||||||||||||||||||||||||||||||||||||||||||||||||||||||||||||||||||||||||||||
| Federal budget deficit/Federal debt | 5 | 4 | 5 | 5 | |||||||||||||||||||||||||||||||||||||||||||||||||||||||||||||||||||||||||||||||||||||||||||||||
| Crime/Violence | 5 | 6 | 3 | 2 | |||||||||||||||||||||||||||||||||||||||||||||||||||||||||||||||||||||||||||||||||||||||||||||||
| Poor healthcare/hospitals | 5 | 3 | 4 | 4 | |||||||||||||||||||||||||||||||||||||||||||||||||||||||||||||||||||||||||||||||||||||||||||||||
| Gallup | |||||||||||||||||||||||||||||||||||||||||||||||||||||||||||||||||||||||||||||||||||||||||||||||||||
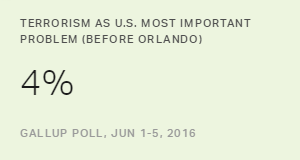
Meanwhile, two issues that have typically topped the most important problem list this year -- the economy and dissatisfaction with government -- have returned to their places. Terrorism has risen slightly from 5% to 9%, despite a lack of high-profile terrorist incidents in the past several weeks in the U.S. The rise in mentions of the economy may be related to the Republican National Convention in Cleveland in mid-July. During the four-day event, speakers including GOP presidential nominee Donald Trump hammered on the economy as a major problem facing voters. In August, Republican mentions of the economy in general as the most important problem have jumped from 14% to 25%, fueling the rise in mentions among all Americans.
Democrats' Satisfaction Rebounds
Democrats' satisfaction with the way things are going in the U.S. plunged from 51% in June to 29% in July, largely explaining the drop in satisfaction last month. Now, that percentage has rebounded to 45%, while Republicans' satisfaction is unchanged at 6%. Independents' satisfaction rose to 27%, up from 16%.
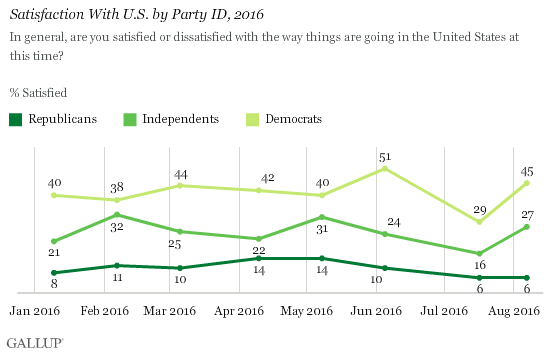
Apart from swings in overall U.S. satisfaction, the measure consistently reflects Americans' feelings about the party of the president. For example, in early 2007, during the presidency of George W. Bush, Republicans' satisfaction with the country's direction was in the low 60s, while Democrats' satisfaction ranged from 16% to 20%. By contrast, in August 2009, with Barack Obama in the White House, Democrats' satisfaction had risen to a high of 59% while Republicans' registered 15%. This dynamic has generally held throughout the Obama presidency.
Bottom Line
With fewer negative headlines regarding race relations and racism dominating news coverage in the past few weeks, Americans are currently less likely to cite race issues as the nation's most important problem, and their overall satisfaction with the state of the country has rebounded to the level of prior months. Mainstay problems such as the economy and government have returned to the forefront, though with neither topic reaching 20% of concern, no single problem dominates as the most important. Americans are generally more likely to be satisfied than they were last month, though only about one in four feel that satisfaction.
Historical data are available in .
Survey Methods
Results for this ���۴�ýpoll are based on telephone interviews conducted Aug. 3-7, 2016, on the ���۴�ýU.S. Daily survey, with a random sample of 1,032 adults, aged 18 and older, living in all 50 U.S. states and the District of Columbia. For results based on the total sample of national adults, the margin of sampling error is ±4 percentage points at the 95% confidence level All reported margins of sampling error include computed design effects for weighting.
Each sample of national adults includes a minimum quota of 60% cellphone respondents and 40% landline respondents, with additional minimum quotas by time zone within region. Landline and cellular telephone numbers are selected using random-digit-dial methods.
View survey methodology, complete question responses and trends.
Learn more about how the works.
