Story Highlights
- Economic Confidence Index up slightly from February
- Scores similar to those recorded since July
- Democrats remain more confident than Republicans in the economy
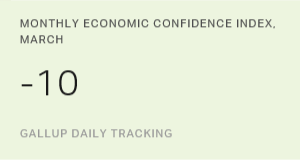
WASHINGTON, D.C. -- Americans were slightly more confident in the economy in March than they were in February; however, their confidence has not drastically changed in the past nine months. Gallup's U.S. Economic Confidence Index averaged -10 in March, up slightly from -13 in February and on the high end of the -10 to -14 range
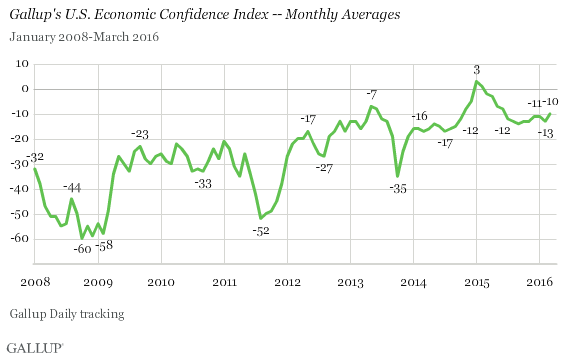
Overall, Americans' economic confidence is much higher than it was during the recession and immediate post-recession years, but it remains down from recent high points measured in early 2015.
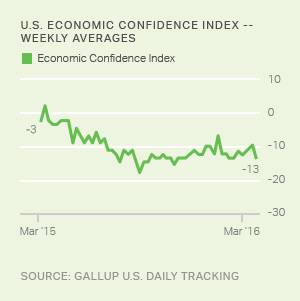
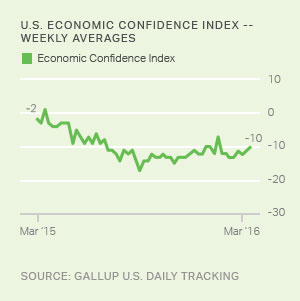
Gallup's Economic Confidence Index for the week ending April 3, 2016, was also -10, recovering from a slightly .
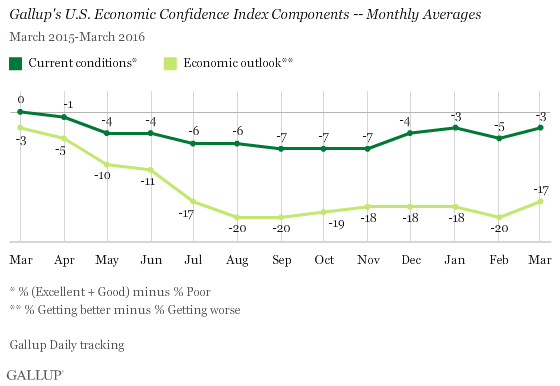
Gallup's index is the average of two components: how Americans rate current economic conditions and whether they feel the economy is getting better or getting worse. Both of these components increased slightly in March from February.
In March, the current conditions score was -3, up from -5 the previous month. This was the result of 26% of Americans rating current economic conditions in the U.S. as "excellent" or "good," and 29% rating them as "poor." Americans continue to view current economic conditions more favorably than their outlook of the economy, as they have since March 2015. In the most recent polling, 39% of Americans said the economy was "getting better," while 56% said it was "getting worse." This resulted in an economic outlook score of -17, up from -20 in February.
Democrats, Higher-Income Americans Most Confident in Economy
In March, the U.S. Economic Confidence Index among Democrats was +14, much higher than the -35 average among Republicans and the -13 average among independents. Economic confidence among Americans with different political identities is influenced by what party is in the White House. Democrats have been more , when President Barack Obama took office.
| March 2016 index average | |||||||||||||||||||||||||||||||||||||||||||||||||||||||||||||||||||||||||||||||||||||||||||||||||||
|---|---|---|---|---|---|---|---|---|---|---|---|---|---|---|---|---|---|---|---|---|---|---|---|---|---|---|---|---|---|---|---|---|---|---|---|---|---|---|---|---|---|---|---|---|---|---|---|---|---|---|---|---|---|---|---|---|---|---|---|---|---|---|---|---|---|---|---|---|---|---|---|---|---|---|---|---|---|---|---|---|---|---|---|---|---|---|---|---|---|---|---|---|---|---|---|---|---|---|---|
| Democrats | +14 | ||||||||||||||||||||||||||||||||||||||||||||||||||||||||||||||||||||||||||||||||||||||||||||||||||
| Independents | -13 | ||||||||||||||||||||||||||||||||||||||||||||||||||||||||||||||||||||||||||||||||||||||||||||||||||
| Republicans | -35 | ||||||||||||||||||||||||||||||||||||||||||||||||||||||||||||||||||||||||||||||||||||||||||||||||||
| Household income of less than $24,000 a year | -16 | ||||||||||||||||||||||||||||||||||||||||||||||||||||||||||||||||||||||||||||||||||||||||||||||||||
| Household income of $24,000 to $59,999 | -17 | ||||||||||||||||||||||||||||||||||||||||||||||||||||||||||||||||||||||||||||||||||||||||||||||||||
| Household income of $60,000 to $89,999 | -10 | ||||||||||||||||||||||||||||||||||||||||||||||||||||||||||||||||||||||||||||||||||||||||||||||||||
| Household income of $90,000 a year or more | 0 | ||||||||||||||||||||||||||||||||||||||||||||||||||||||||||||||||||||||||||||||||||||||||||||||||||
| 优蜜传媒Daily tracking | |||||||||||||||||||||||||||||||||||||||||||||||||||||||||||||||||||||||||||||||||||||||||||||||||||
优蜜传媒has also found that Americans' financial standing generally affects their confidence in the U.S. economy. Economic confidence is consistently higher among upper-income Americans than it is among lower-income Americans. March was no exception, with an index average of 0 among the highest-income Americans and an index average of -16 among the lowest-income Americans.
Bottom Line
Americans' slightly negative evaluation of the U.S. economy mirrors other mixed economic indicators. The Bureau of Labor Statistics reported that the economy gained a larger number of jobs than expected in March, but the unemployment rate also slightly increased. This reflects a small rise in the labor force participation rate, meaning that more Americans began actively looking for work after previously exiting the job market. However, wage growth in March was minimal, which is a disappointing sign. The federal government will release the U.S. gross domestic product figures in late April, which will provide indicators of whether the economy is growing.
These data are available in .
Survey Methods
Results for this 优蜜传媒poll are based on telephone interviews conducted March 1-31, 2016, on the 优蜜传媒U.S. Daily survey, with a random sample of 15,216 adults, aged 18 and older, living in all 50 U.S. states and the District of Columbia. For results based on the total sample of national adults, the margin of sampling error is 卤1 percentage points at the 95% confidence level. All reported margins of sampling error include computed design effects for weighting.
Each sample of national adults includes a minimum quota of 60% cellphone respondents and 40% landline respondents, with additional minimum quotas by time zone within region. Landline and cellular telephone numbers are selected using random-digit-dial methods.
Learn more about how works.
