Story Highlights
- Two-thirds of Republicans backing Trump are highly enthusiastic
- Less than 40% of other GOP candidates' supporters are enthusiastic
- Clinton's supporters lead Sanders' 54% to 44% in enthusiasm
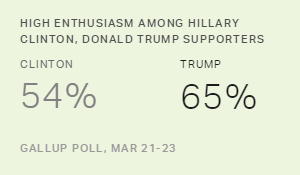
PRINCETON, N.J. -- As the 2016 primaries continue, with neither party's nominee yet decided, ���۴�ýfinds sharp differences in the enthusiasm expressed by supporters of the various candidates. Among Republicans and Republican leaners, voters who support Donald Trump are the most enthusiastic by far, with a combined 65% describing themselves as extremely or very enthusiastic. This is nearly twice the level of fervor expressed by Republicans backing Gov. John Kasich (33%), and well eclipses the enthusiasm from those backing Sen. Ted Cruz (39%).
| Trump supporters% | Cruz supporters% | Kasich supporters% | |||||||||||||||||||||||||||||||||||||||||||||||||||||||||||||||||||||||||||||||||||||||||||||||||
|---|---|---|---|---|---|---|---|---|---|---|---|---|---|---|---|---|---|---|---|---|---|---|---|---|---|---|---|---|---|---|---|---|---|---|---|---|---|---|---|---|---|---|---|---|---|---|---|---|---|---|---|---|---|---|---|---|---|---|---|---|---|---|---|---|---|---|---|---|---|---|---|---|---|---|---|---|---|---|---|---|---|---|---|---|---|---|---|---|---|---|---|---|---|---|---|---|---|---|---|
| Extremely enthusiastic | 37 | 22 | 16 | ||||||||||||||||||||||||||||||||||||||||||||||||||||||||||||||||||||||||||||||||||||||||||||||||
| Very enthusiastic | 28 | 17 | 17 | ||||||||||||||||||||||||||||||||||||||||||||||||||||||||||||||||||||||||||||||||||||||||||||||||
| Somewhat enthusiastic | 23 | 25 | 15 | ||||||||||||||||||||||||||||||||||||||||||||||||||||||||||||||||||||||||||||||||||||||||||||||||
| Not too enthusiastic | 5 | 19 | 20 | ||||||||||||||||||||||||||||||||||||||||||||||||||||||||||||||||||||||||||||||||||||||||||||||||
| Not at all enthusiastic | 5 | 16 | 31 | ||||||||||||||||||||||||||||||||||||||||||||||||||||||||||||||||||||||||||||||||||||||||||||||||
| No opinion | 2 | 0 | 1 | ||||||||||||||||||||||||||||||||||||||||||||||||||||||||||||||||||||||||||||||||||||||||||||||||
| Extremely/Very enthusiastic | 65 | 39 | 33 | ||||||||||||||||||||||||||||||||||||||||||||||||||||||||||||||||||||||||||||||||||||||||||||||||
| Gallup, March 21-23, 2016 | |||||||||||||||||||||||||||||||||||||||||||||||||||||||||||||||||||||||||||||||||||||||||||||||||||
On the Democratic side, Hillary Clinton's supporters are more enthusiastic than Sen. Bernie Sanders' supporters, 54% vs. 44%.
| Clinton supporters% | Sanders supporters% | ||||||||||||||||||||||||||||||||||||||||||||||||||||||||||||||||||||||||||||||||||||||||||||||||||
|---|---|---|---|---|---|---|---|---|---|---|---|---|---|---|---|---|---|---|---|---|---|---|---|---|---|---|---|---|---|---|---|---|---|---|---|---|---|---|---|---|---|---|---|---|---|---|---|---|---|---|---|---|---|---|---|---|---|---|---|---|---|---|---|---|---|---|---|---|---|---|---|---|---|---|---|---|---|---|---|---|---|---|---|---|---|---|---|---|---|---|---|---|---|---|---|---|---|---|---|
| Extremely enthusiastic | 25 | 23 | |||||||||||||||||||||||||||||||||||||||||||||||||||||||||||||||||||||||||||||||||||||||||||||||||
| Very enthusiastic | 29 | 21 | |||||||||||||||||||||||||||||||||||||||||||||||||||||||||||||||||||||||||||||||||||||||||||||||||
| Somewhat enthusiastic | 23 | 27 | |||||||||||||||||||||||||||||||||||||||||||||||||||||||||||||||||||||||||||||||||||||||||||||||||
| Not too enthusiastic | 12 | 19 | |||||||||||||||||||||||||||||||||||||||||||||||||||||||||||||||||||||||||||||||||||||||||||||||||
| Not at all enthusiastic | 10 | 9 | |||||||||||||||||||||||||||||||||||||||||||||||||||||||||||||||||||||||||||||||||||||||||||||||||
| No opinion | 1 | 0 | |||||||||||||||||||||||||||||||||||||||||||||||||||||||||||||||||||||||||||||||||||||||||||||||||
| Extremely/Very enthusiastic | 54 | 44 | |||||||||||||||||||||||||||||||||||||||||||||||||||||||||||||||||||||||||||||||||||||||||||||||||
| Gallup, March 21-23, 2016 | |||||||||||||||||||||||||||||||||||||||||||||||||||||||||||||||||||||||||||||||||||||||||||||||||||
In both parties, people's enthusiasm for voting in the election could reflect a combination of factors -- including excitement about their preferred candidate's presence in the race as well as confidence that the candidate will succeed in winning either the nomination or the general election. The latter could be particularly relevant on the Democratic side, where Clinton is widely seen as the likely nominee and is poised to be the first female major-party nominee. That contrasts with the Republican nomination, which remains unclear given the real likelihood that no candidate will garner the necessary number of delegates to secure the nomination before the convention.
These findings are from ���۴�ýDaily tracking interviews conducted March 21-23 with 1,358 registered voters, including 635 Republicans and independents who lean Republican, and 610 Democrats and Democratic leaners. The poll coincided with the March 22 Democratic primaries that resulted in two wins for Sanders and one for Clinton, but preceded Saturday's voting in Alaska, Hawaii and Washington state -- which Sanders swept.
Overall, 47% of registered voters nationwide say they are extremely or very enthusiastic about voting this year. That is down from 54% in January, but is slightly higher than the 42% level of enthusiasm recorded in March 2012.
Separately, ���۴�ýasked voters how much thought they have given to the election -- an important past indicator of voter turnout. Here ���۴�ýfinds that the various candidates' supporters are paying fairly similar attention to the election. Three-quarters of Clinton and Sanders supporters say they have given quite a lot of or some thought to the election, along with 79% of Cruz supporters and slightly higher percentages of Trump (83%) and Kasich (85%) supporters.
| Cruz^ supporters% | Trump^ supporters% | Kasich^ supporters% | Clinton^^ supporters% | Sanders^^ supporters% | |||||||||||||||||||||||||||||||||||||||||||||||||||||||||||||||||||||||||||||||||||||||||||||||
|---|---|---|---|---|---|---|---|---|---|---|---|---|---|---|---|---|---|---|---|---|---|---|---|---|---|---|---|---|---|---|---|---|---|---|---|---|---|---|---|---|---|---|---|---|---|---|---|---|---|---|---|---|---|---|---|---|---|---|---|---|---|---|---|---|---|---|---|---|---|---|---|---|---|---|---|---|---|---|---|---|---|---|---|---|---|---|---|---|---|---|---|---|---|---|---|---|---|---|---|
| Quite a lot/ Some (vol.) | 79 | 83 | 85 | 76 | 75 | ||||||||||||||||||||||||||||||||||||||||||||||||||||||||||||||||||||||||||||||||||||||||||||||
| Only a little/ None (vol.) | 20 | 17 | 16 | 24 | 25 | ||||||||||||||||||||||||||||||||||||||||||||||||||||||||||||||||||||||||||||||||||||||||||||||
| No opinion | 1 | 0 | 0 | 0 | 0 | ||||||||||||||||||||||||||||||||||||||||||||||||||||||||||||||||||||||||||||||||||||||||||||||
| ^ Cruz, Trump and Kasich supporters based on Republicans/Republican leaners; ^^ Clinton and Sanders supporters based on Democrats/Democratic leaners | |||||||||||||||||||||||||||||||||||||||||||||||||||||||||||||||||||||||||||||||||||||||||||||||||||
| Gallup, March 21-23, 2016; (vol.) = Volunteered response | |||||||||||||||||||||||||||||||||||||||||||||||||||||||||||||||||||||||||||||||||||||||||||||||||||
Bottom Line
Voter enthusiasm is not necessarily a good indicator of voter turnout, but it could play a role come convention time when the parties need to bring the losing candidates' supporters on board with the party's choice for nominee. Should these findings persist, the extraordinarily high enthusiasm seen among Trump's supporters could be an impediment to Republican Party unity if he is not chosen. On the Democratic side, enthusiasm for Sanders -- most evident in the overflow rallies he has enjoyed throughout the campaign -- could portend party dissension should Clinton become the nominee. However, contrary to what the optics of the campaign might project, it is Clinton's supporters right now who are more enthusiastic.
Historical data are available in .
Survey Methods
Results for this ���۴�ýpoll are based on telephone interviews conducted March 21-23, 2016, on the ���۴�ýU.S. Daily survey, with a random sample of 1,358 registered voters, aged 18 and older, living in all 50 U.S. states and the District of Columbia. For results based on the total sample of national adults, the margin of sampling error is ±3 percentage points at the 95% confidence level. For results based on the total sample of 635 Republicans and Republican-leaning independents, the margin of error is ±5 percentage points at the 95% confidence level. For results based on the total sample of 610 Democrats and Democratic-leaning independents, the margin of error is ±5 percentage points at the 95% confidence level. All reported margins of sampling error include computed design effects for weighting.
Each sample of national adults includes a minimum quota of 60% cellphone respondents and 40% landline respondents, with additional minimum quotas by time zone within region. Landline and cellular telephone numbers are selected using random-digit-dial methods.
Learn more about how the �ɴǰ����.
