Story Highlights
- 40% of Republicans say one party better, up from 24%
- More independents say party control makes no difference
- Americans most likely to say party control makes no difference
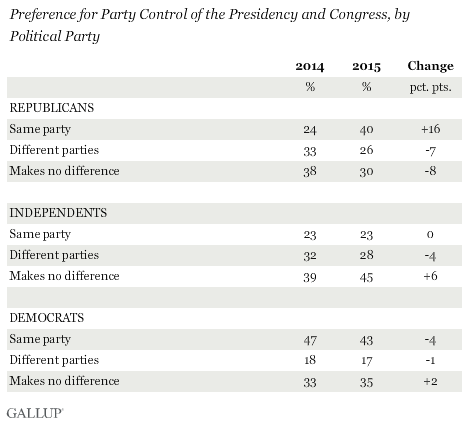
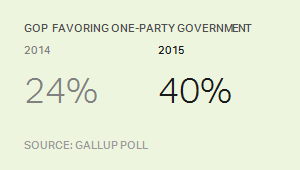
PRINCETON, N.J. -- In a shift from last year, Republicans now clearly prefer having one party control Congress and the presidency, as opposed to favoring divided party control or saying it makes no difference. Forty percent of Republicans favor one-party control, up from 24% last year. This change makes their views similar to Democrats' views, which are essentially unchanged from last year. Independents are more likely now (45%) than last year (39%) to say party control makes no difference.

Since last year's survey, two major political developments have occurred that could be influencing Republicans' views on the best way to distribute party control of government. First, Republicans won a majority of U.S. Senate seats in the November 2014 elections, giving them control of both houses of Congress.
Second, the focus of political attention has increasingly shifted toward the 2016 presidential election campaign and away from President Barack Obama. Republicans may be optimistic about their chances of electing a Republican president, particularly since Democratic front-runner Hillary Clinton by the email server controversy.

Democrats may also be optimistic about winning in 2016, but given that a Democrat currently occupies the White House, their preference for one-party control of government is understandably unchanged.
Although the question seemingly asks Americans for a normative view as to which type of government is best, the practical matter of the president's party has strongly influenced their preferences.
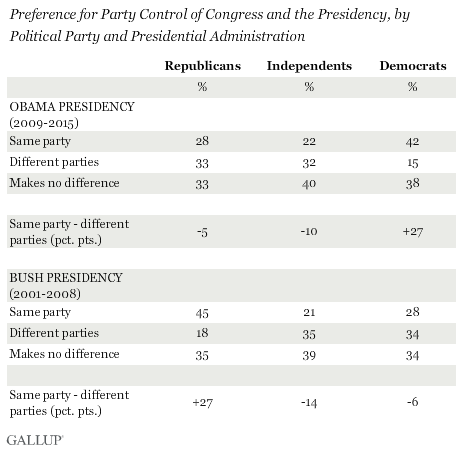
In Gallup's 13-year trend, when a Democratic president (namely Obama) has been in power, Democrats have been more likely to prefer one-party government, and Republicans divided government. When a Republican (namely George W. Bush) has been president, party supporters' preferences have shown the opposite pattern. This suggests partisans may view the party of the president as "fixed" and are answering in terms of how control of Congress should be adjusted to maximize their preferred party's power in Washington.
Unlike partisans, independents' views have been similar regardless of who is in the White House, with the greatest number saying it makes no difference, and more favoring divided government than one-party government.

Americans Overall Most Likely to Say Party Control Makes No Difference
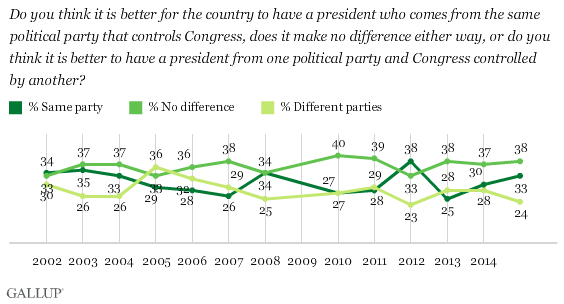
Republicans make up a relatively small percentage of the adult population, 27%, so their sharply increased preference for one-party government this year produces just a slight increase in the percentage of all Americans who favor one-party government, from 30% to 33%.
Meanwhile, the percentage of all Americans preferring divided government has decreased since 2014, from 28% to 24%, and the percentage saying it makes no difference remains essentially unchanged, partly because the independent increase in this view has offset the Republican decline. "No difference" remains the most common response, as it typically has been, among all Americans at 38%.

Since 2002, there have been just a few years in which "no difference" was not the most common response. This includes three years when the percentage of Americans who preferred one-party control met or exceeded the percentage not having a preference: 2002, when George W. Bush maintained high job approval ratings a year after the 9/11 terrorist attacks, and the presidential election years of 2008 and 2012. In 2012, a record-high 38% said they preferred one-party control of government in a poll conducted just after that year's Democratic National Convention.
In 2005, when Bush's and Republicans still had control of both houses of Congress, a record-high 36% of Americans favored divided government.
Implications
Given Americans' -- which to a large degree is a function of having divided government -- one might expect Americans to be a little more open to having one party control both the president and Congress. But Americans' views on divided government are complex.
To a large degree, their opinions are influenced by partisans' desire to maximize their favored party's power in the current political environment. But in addition to those immediate and practical political desires, many Americans, particularly independents, seem to have normative concerns about giving one party too much power. That attitude would explain why recent eras of one-party government -- including 1993-1994, 2002-2006 and 2009-2010 -- were short-lived. Once the incumbent president in those eras became unpopular, voters gave control of one or both houses of Congress to the opposition party in the next midterm election.
Additionally, a substantial percentage of Americans do not see either one-party or divided control as better than the other. Whether that reflects their own evaluations of how the government has performed under divided versus unified government, or just a more cynical view of government, is unclear.
Thus, Americans may never reach a consensus as to how the government should operate. But even if they did, it would be hard for voters to make it come about. This is especially true in presidential election years, as voters would not know for sure which party would win the White House at the same time they are voting for different members of Congress, all of whom represent narrow geographical areas. It is more feasible for voters to "choose" divided or unified government in midterm elections because the president of the party after the election is known as voters cast their ballots.
Historical data are available in .
Survey Methods
Results for this 优蜜传媒poll are based on telephone interviews conducted Sept. 9-13, 2015, with a random sample of 1,025 adults, aged 18 and older, living in all 50 U.S. states and the District of Columbia. For results based on the total sample of national adults, the margin of sampling error is ±4 percentage points at the 95% confidence level. All reported margins of sampling error include computed design effects for weighting.
Each sample of national adults includes a minimum quota of 60% cellphone respondents and 40% landline respondents, with additional minimum quotas by time zone within region. Landline and cellular telephone numbers are selected using random-digit-dial methods.
View survey methodology, complete question responses and trends.
Learn more about how works.