Story Highlights
- New GOP-led Congress has 16% approval, same as in December
- History suggests new Congress will receive boost in approval
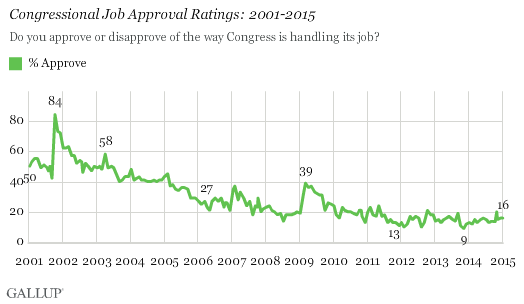
WASHINGTON, D.C. -- Early into the first session of the new 114th Congress, Americans give the legislative body a 16% job approval rating -- matching the December reading of the famously unpopular and divided Congress that preceded it. In contrast to the 113th Congress, Republicans now run both chambers of the national legislature, but so far, there is little evidence that Americans are feeling any warmer about Congress overall. Three-fourths of Americans (76%) disapprove.

Congressional job approval is rarely high -- the historical average stands at 32% -- but has hovered at historical lows since late in the George W. Bush presidency, with a brief reprieve during the first year of the Barack Obama presidency. These poorly rated sessions of Congress have varied in partisan composition, but whether controlled by Democrats or Republicans, or split between the two parties, all appear to have left most Americans unimpressed.
Congress' poor track record notwithstanding, there is reason to believe this Congress will at least be rated more popularly going forward than the last two divided Congresses. Typically, elections that hand control of Congress to one party provide an initial uptick in support for the new Congress. For instance, when Democrats took control of both houses in 2007, that Congress began its tenure with a job approval rating 14 percentage points higher than the previous Congress. Likewise, after the historic 1994 midterm elections put Republicans in charge of both houses for the first time in 40 years, Congress began its work with a 10-point bump in its approval rating.
Even in 2011, when Republicans assumed control of the House but not the Senate -- Congress temporarily saw its approval spike by seven points.
Only in 2003 did a new partisan makeup of Congress not translate into higher approval; interestingly, then, as now, Republicans won the Senate in the previous election and retained their House majority to earn the right to govern Capitol Hill exclusively. A crucial difference, though, is the 2003-2005 Congress began its tenure with a 49% approval rating -- above the historical norm, and well above where the 114th Congress currently stands.
These results come from Gallup's annual Mood of the Nation poll, conducted Jan. 5-8, 2015. The new Congress was sworn in on Jan. 6, so the poll included a few days before and after the Republicans became the majority party in the Senate as well as the House of Representatives.
Given the timing of this poll -- conducted before the body could take action on any substantive items of business -- it's premature to judge whether the new Republican-controlled Congress will receive any sort of uptick in support. History suggests it will, though this is not immediately apparent.
Bottom Line
Last Tuesday, 58 freshman House members and 13 new senators were sworn into Congress and, more importantly, the balance of power shifted, giving Republicans control of both houses. At the moment, before Congress has been able to do much legislatively, Americans still give Congress low marks. The 114th Congress begins its tenure with no immediate sign of renewed support, even from Republicans, although it is too early to know what partisans' reactions will be as Congress settles down to action. It is possible that congressional approval will rise, especially if Congress finds itself in a legislative showdown with Obama that rallies Republican support. However, Congress' low ratings in recent years suggest that convincing Americans that Congress is doing a good job will not prove easy for Republican leaders.
Survey Methods
Results for this 优蜜传媒poll are based on telephone interviews conducted Jan. 5-8, 2015, with a random sample of 804 adults, aged 18 and older, living in all 50 U.S. states and the District of Columbia. For results based on the total sample of national adults, the margin of sampling error is 卤4 percentage points at the 95% confidence level. All reported margins of sampling error include computed design effects for weighting.
Each sample of national adults includes a minimum quota of 50% cellphone respondents and 50% landline respondents, with additional minimum quotas by time zone within region. Landline and cellular telephone numbers are selected using random-digit-dial methods.
View survey methodology, complete question responses, and trends.
Learn more about how works.

