WASHINGTON, D.C. -- Sixty-five percent of Americans are dissatisfied with the nation's system of government and how well it works, the highest percentage in Gallup's trend since 2001. Dissatisfaction is up five points since last year, and has edged above the previous high from 2012 (64%).

These findings are from Gallup's annual Mood of the Nation poll, conducted Jan. 5-8, 2014. The trend line on this measure shows remarkable change over time, rising from fewer than one in four Americans expressing dissatisfaction in 2002, after the 9/11 terrorist attacks, to the current situation in which almost two-thirds are dissatisfied.
Republicans and Independents Less Satisfied, Democrats Remain Consistent
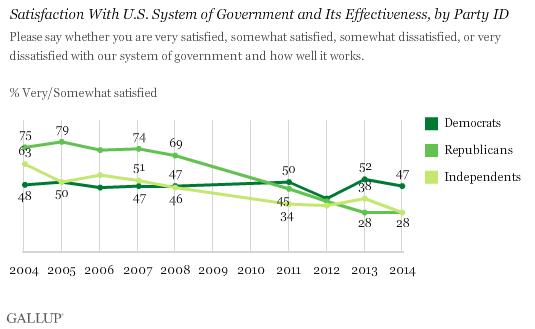
Republicans and independents are largely responsible for the overall decrease in satisfaction with government effectiveness in recent years. Satisfaction among Republicans and independents began to wane during President George W. Bush's final year in office. This may have reflected mounting public dissatisfaction with the Iraq war, coupled with the Democratic takeover of Congress after the 2006 midterm elections. Both groups' satisfaction plummeted still more between 2008 and 2011, and has since dipped further. Republicans' satisfaction went from a peak of 79% in 2005 to a low of 28% in each of the past two years. Meanwhile, Democrats' satisfaction has been remarkably steady, generally hovering near 50%, and is essentially the same as it was in 2004 under a Republican president.
Democrats' satisfaction might have been much higher today, with a Democrat in the White House, if not for the twin problems of the economy and partisan gridlock that have among both parties. Satisfaction among Republicans, which has directly correlated with the party of the president in office, continues at its depressed level, with this year's reading tying the record low from 2013. Satisfaction among independents, meanwhile, has gone down 10 percentage points during that same time.

Dissatisfaction Carries Over to Americans' Views on Government Size and Power
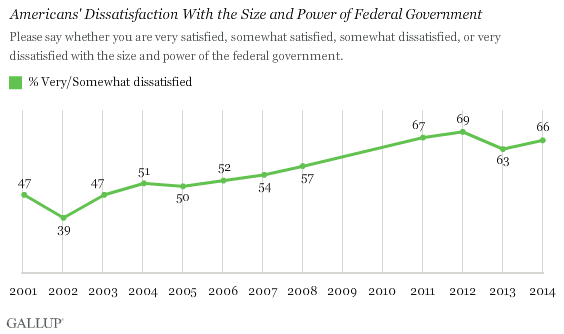
One reason Americans are dissatisfied with how the government system is working is that they believe it is too big and powerful. Two-thirds of Americans (66%) are unhappy with the size and power of the federal government. These views potentially hamper President Barack Obama's ability to propose large-scale government solutions in his State of the Union speech next week. However, this problem is not a new one for the president. Roughly two-thirds of Americans have expressed this view consistently since at least 2011, after the measure jumped a full 10 points between 2008 and 2011.

Bottom Line
Obama and the elected representatives in Congress have faced a tough audience in the American public in recent years, with the majority dissatisfied with the performance of government and concerned about its size and power. This year will be no different as the president prepares to speak to the nation next week. And even a slight majority of those in his own party are generally dissatisfied with how government is working. This dissatisfaction is also reflected in Gallup's separate question measuring Americans' perceptions of the most important problem facing the country; dysfunctional government is .
Outside of the president's party, unhappiness with federal government size and effectiveness has only grown during his time in office. Republican satisfaction with the government's effectiveness dropped dramatically after Obama's 2008 election, while that of independents fell a bit more gradually.
Survey Methods
Results for this 优蜜传媒poll are based on telephone interviews conducted Jan. 5-8, 2014, with a random sample of 1,018 adults, aged 18 and older, living in all 50 U.S. states and the District of Columbia.
For results based on the total sample of registered voters, the margin of sampling error is 卤4 percentage points at the 95% confidence level.
Interviews are conducted with respondents on landline telephones and cellular phones, with interviews conducted in Spanish for respondents who are primarily Spanish-speaking. Each sample of national adults includes a minimum quota of 50% cellphone respondents and 50% landline respondents, with additional minimum quotas by time zone within region. Landline and cellular telephone numbers are selected using random-digit-dial methods. Landline respondents are chosen at random within each household on the basis of which member had the most recent birthday.
Samples are weighted to correct for unequal selection probability, nonresponse, and double coverage of landline and cell users in the two sampling frames. They are also weighted to match the national demographics of gender, age, race, Hispanic ethnicity, education, region, population density, and phone status (cellphone only/landline only/both, cellphone mostly, and having an unlisted landline number). Demographic weighting targets are based on the most recent Current Population Survey figures for the aged 18 and older U.S. population. Phone status targets are based on the most recent National Health Interview Survey. Population density targets are based on the most recent U.S. census. All reported margins of sampling error include the computed design effects for weighting.
In addition to sampling error, question wording and practical difficulties in conducting surveys can introduce error or bias into the findings of public opinion polls.
View methodology, full question results, and trend data.
For more details on Gallup's polling methodology, visit .
