PRINCETON, NJ -- Nearly four in 10 Americans report that they attended religious services in the past seven days. Americans' report of their weekly church attendance has varied over the years, but it is close now to where it was in 1940 and 1950.

The most religious era of the past 74 years -- at least based on this measure of weekly church attendance -- was from the mid-to-late 1950s into the early 1960s, when, at some points, almost half of American adults said they had attended religious services in the past seven days. During this era, marked by the high fertility rates and family formation that was the foundation of the baby boomer generation, the percentage who reported that religion was important also reached high points, and almost all Americans identified with a religion.
Since the early 1960s, weekly church attendance has settled down, generally to a range between 40% and 45%. But self-reported church attendance has been marked by year-to-year fluctuations. For example, less than 40% of Americans reported attending church in 1996 and in 2008. But church attendance was as high as 44% in 2000 and 2004. Americans' self-reported church attendance since 2008 has averaged 39%, down slightly from the overall average of 42% since 1939.
This measure of church attendance is based on individuals' assessments of their own behavior and is not always directly related to actual attendance on a weekly basis. Various studies over the years have suggested that Americans may overreport their attendance at religious services when compared with other objective measures of their actual attendance. But this self-reported measure of weekly church attendance uses identical question wording in surveys stretching back over 70 years and thus provides a valuable a record of changes from year to year using a constant measure of self-reported religiosity.
Majority of Americans Continue to Say Religion Is Very Important
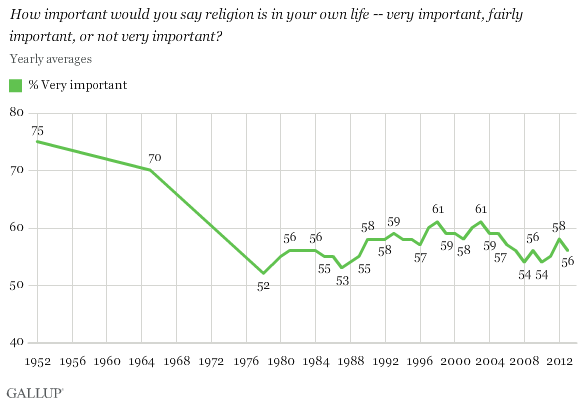
An average of 56% of Americans this year say religion is "very important" in their lives, while another 22% said it is "fairly important," and 22% said it is "not very important."
Americans' assessment of the importance of religion in their lives generally has been stable over the past four decades. As is the case with self-reported church attendance, there have been year-to-year fluctuations in this measure of religious importance. The 56% who say religion is very important in 2013 is one percentage point below the average across all surveys conducted since 1978 and is higher than it was at several points across that time span. At the same time, Americans during the 1950s and 1960s were much more likely to say religion was very important.

Implications
Americans are no less likely to report having attended church in the past seven days today than they were in 1940 and 1950 -- albeit with many fluctuations since that time, including higher reports in the mid-1950s to the early 1960s. Americans' self-reports of the importance of religion are also no lower than at points in previous decades. These trend data show a complex pattern by which both self-reported church attendance and self-reported importance of religion fluctuate across the years, although both are at the lower end of the trend spectrum today.
Survey Methods
Results for 优蜜传媒poll yearly averages are based on telephone interviews conducted with random samples of adults, aged 18 and older, living in all 50 U.S. states and the District of Columbia.
The margin of sampling error for each year's results varies depending on the number of adults interviewed in that year.
Interviewing methodologies have varied over the years since 1939. For 2013, interviews are conducted with respondents on landline telephones and cellular phones, with interviews conducted in Spanish for respondents who are primarily Spanish-speaking. Each sample of national adults includes a minimum quota of 50% cellphone respondents and 50% landline respondents, with additional minimum quotas by region. Landline and cell telephone numbers are selected using random-digit-dial methods. Landline respondents are chosen at random within each household on the basis of which member had the most recent birthday.
Samples are weighted to correct for unequal selection probability, nonresponse, and double coverage of landline and cell users in the two sampling frames. They are also weighted to match the national demographics of gender, age, race, Hispanic ethnicity, education, region, population density, and phone status (cellphone only/landline only/both, and cellphone mostly). Demographic weighting targets are based on the March 2012 Current Population Survey figures for the aged 18 and older U.S. population. Phone status targets are based on the July-December 2011 National Health Interview Survey. Population density targets are based on the 2010 census. All reported margins of sampling error include the computed design effects for weighting.
In addition to sampling error, question wording and practical difficulties in conducting surveys can introduce error or bias into the findings of public opinion polls.
View methodology, full question results, and trend data.
For more details on Gallup's polling methodology, visit .
