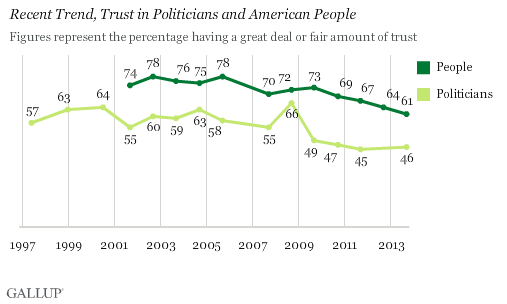
PRINCETON, NJ -- Americans' trust in "the American people" to make judgments about political issues facing the country has declined each year since 2009 and, at 61%, is down nearly 20 percentage points from its recent peak in 2005. Still, that exceeds the 46% of Americans who trust the "men and women … who either hold or are running for public office," which is one point above the historical low from 2011.

The results are based on Gallup's annual Governance survey, conducted Sept. 5-8. The same poll found that Americans' trust in the federal government to handle , their trust in the , and their trust in the are all at or near historical lows.
Americans' trust in political officeholders and candidates has also generally trended downward in recent years, apart from a spike in September 2008, during the fall presidential campaign. That year, Americans viewed the major-party candidates -- Barack Obama and John McCain -- than any other recent pair of presidential candidates.
The public's declining trust in the American people to make judgments about political issues could be part of a more general process of declining trust in most governing institutions. It may also be an outgrowth of increasing polarization in the United States on key issues. Americans may trust "the people" less when they are more conscious that segments of the population hold views radically different from their own.
���۴�ýfirst asked about trust in U.S. politicians and the American people from 1972 through 1976. During those years, Americans were generally more positive toward each than they have been since the late 1990s, when ���۴�ýresumed asking the questions.
From 1972-1976, 66% of Americans, on average, said they had a "great deal" or "fair amount" of trust in the men and women holding or seeking political office, including a high of 68% in 1974. That compares with an average of 56% trust since 1997.
Americans' average level of trust in the American people during the 1970s was 85%, including a high of 86% in 1976. The average since 2001 is 71%.
Democrats Most Trusting of American People
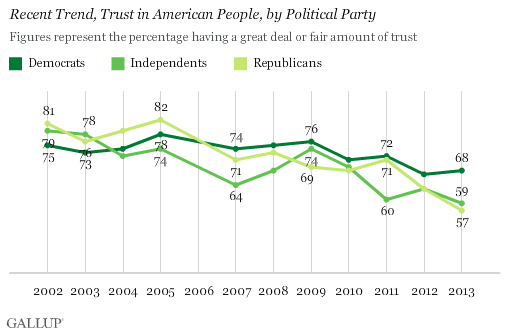
Sixty-eight percent of Democrats trust the American people to make political judgments, compared with 59% of independents and 57% of Republicans. All three party groups are less trusting now than in the past, though Democrats have shown a smaller decline than independents or Republicans.

During several years in which George W. Bush was president, Republicans had more trust in the people than Democrats did. From 2007 on, Republicans have been at least slightly less trusting. This year's 11-point gap is larger than what ���۴�ýhas measured recently.
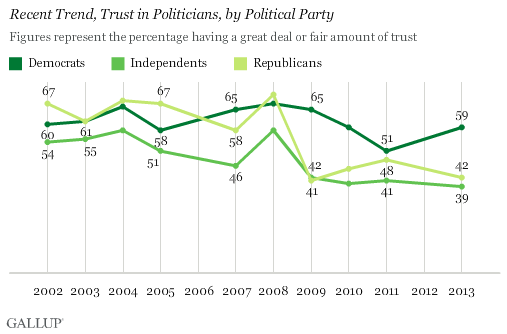
Democrats also are more trusting of the men and women who hold or seek political office, at 59%, compared with 42% of Republicans and 39% of independents. Independents typically have been least trusting of politicians. Republicans' trust in political officeholders was equal to or higher than Democrats' in a number of years of the George W. Bush administration.

Implications
U.S. political leaders are operating in an era of declining trust in U.S. political institutions, with trust in these at or near record lows. Americans even now have diminished trust in their fellow citizens to make political judgments under the democratic system, though they still trust themselves much more than the elected officeholders who make public policy.
Much of the decline in trust has been evident since 2009, so it could be tied to the economic downturn and sluggish recovery. It also may reflect Republicans' and Democrats' dissatisfaction with voters' choices in the 2010 and 2012 elections, which has contributed to a more confrontational political atmosphere in Washington, given divided party control of Congress.
Americans give Congress very in general, and the decline in trust in "the people" may reflect the fact that it is the American people who elected those poorly regarded representatives. The increasing gap between Democrats and Republicans in trust in the people also suggests that political polarization may be causing the erosion in faith in the people themselves.
Restoring political trust then may depend on establishing greater political civility and cooperation in Washington, with leaders showing more respect for those in the opposing party out of deference to the voters' will, and trying to reach agreement on key political issues. A more robust economic recovery, which would surely put most Americans in a better mood overall, may also help them see their political leaders and institutions in a more favorable light.
Survey Methods
Results for this ���۴�ýpoll are based on telephone interviews conducted Sept. 5-8, 2013 with a random sample of 1,510 adults, aged 18 and older, living in all 50 U.S. states and the District of Columbia.
For results based on the total sample of national adults, one can say with 95% confidence that the margin of sampling error is ±3 percentage points.
Interviews are conducted with respondents on landline telephones and cellular phones, with interviews conducted in Spanish for respondents who are primarily Spanish-speaking. Each sample of national adults includes a minimum quota of 50% cellphone respondents and 50% landline respondents, with additional minimum quotas by region. Landline and cell telephone numbers are selected using random-digit-dial methods. Landline respondents are chosen at random within each household on the basis of which member had the most recent birthday.
Samples are weighted to correct for unequal selection probability, nonresponse, and double coverage of landline and cell users in the two sampling frames. They are also weighted to match the national demographics of gender, age, race, Hispanic ethnicity, education, region, population density, and phone status (cellphone only/landline only/both, and cellphone mostly). Demographic weighting targets are based on the March 2012 Current Population Survey figures for the aged 18 and older U.S. population. Phone status targets are based on the July-December 2011 National Health Interview Survey. Population density targets are based on the 2010 census. All reported margins of sampling error include the computed design effects for weighting.
In addition to sampling error, question wording and practical difficulties in conducting surveys can introduce error or bias into the findings of public opinion polls.
View methodology, full question results, and trend data.
For more details on Gallup's polling methodology, visit .
