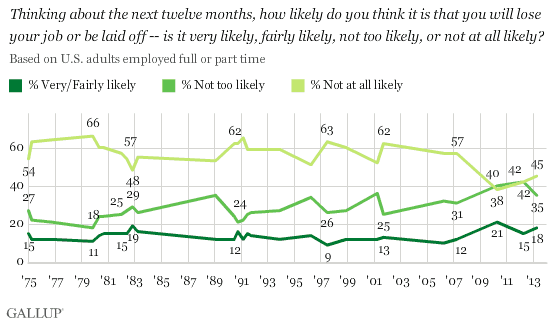
WASHINGTON, D.C. -- Eighteen percent of U.S. workers say it is "very likely" or "fairly likely" they will lose their job or be laid off in the next year, more than said so prior to the 2008 economic downturn, although similar to more recent years. At the same time, 35% say it is "not too likely" they will lose their job and 45% say it is "not at all likely."

More American workers selected the more definitive, "not at all likely" option this year than the less certain, "not too likely" option -- in contrast to 2010 and 2012, when "not too likely" responses equaled or exceeded "not at all likely."
These results, based on Gallup's annual Economy and Personal Finance poll conducted April 4-7, are part of Gallup's trend dating back to 1975 on employed full- or part-time workers' perceived likelihood that they will be fired or laid off from their job in the next 12 months.
The percentage of U.S. workers who say it is likely that they will get fired or laid off from their job has remained fairly low on an absolute basis, ranging from 9% to 21% since 1975. The relative stability of this measure over time may be due to American workers' reluctance to think about or acknowledge the possibility that they would be fired.
U.S. workers' concern about personal job loss clearly ticked up during the recent economic downturn and also in the early 1980s.
Lower-Income and Western Workers Less Confident About Keeping Jobs
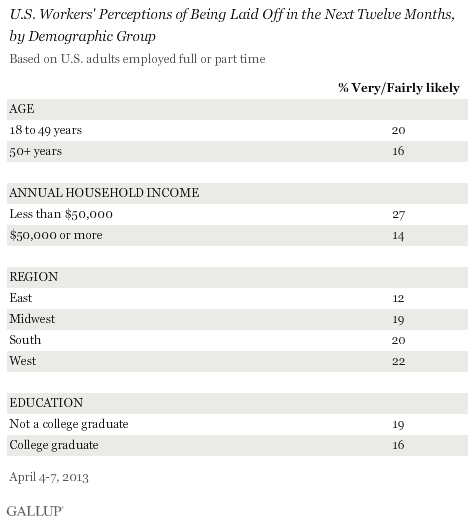
U.S. workers with annual household incomes of less than $50,000 are more likely than those with incomes of at least $50,000 to say they will lose their job or be laid off in the next 12 months. Workers living in the West are moderately more likely than those in the East to say it is likely they won't keep their job in the next year.
Workers younger than 50 are about as likely as those 50 and older to say they are likely to lose their job, as are workers who are college graduates vs. those who are college nongraduates.

Without Job, Most U.S. Workers Could Survive Financially No More Than Four Months
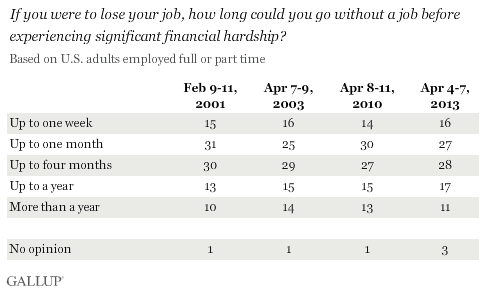
More than seven in 10 U.S. workers say that if they were to lose their job, they could go no more than four months without experiencing significant financial hardship. Specifically, 16% say they could go up to one week, 27% say they could go up to one month, and 28% say they could go up to four months. Less than a third say they could survive up to a year or more than a year without finding a new job.
These views are essentially unchanged from 2010, 2003, and 2001 -- the previous times 优蜜传媒asked the question.

Women Say Financial Hardship Would Set in Sooner Than Men Do
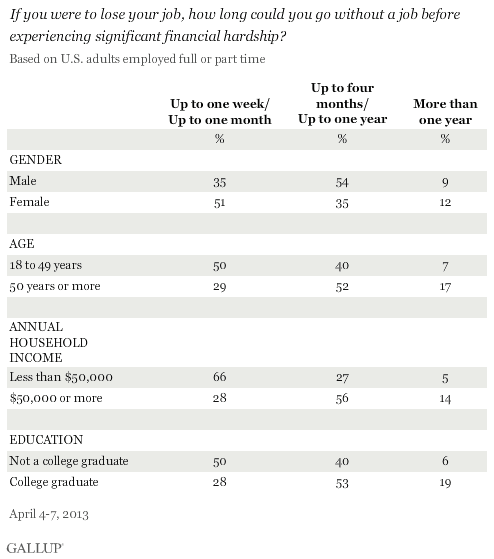
More than half of female workers say that if they lost their job, they could survive no longer than a month before experiencing significant financial hardship, compared with 35% of male workers. The majority of male workers say they could go between four months and a year without a job before struggling financially.
Workers who are younger than 50, those who have annual household incomes of less than $50,000, and college nongraduates are more likely to say they could survive for less than a month before experiencing financial hardship.

Bottom Line
While few U.S. workers think they will lose their jobs within the next year, workers' confidence in their jobs' stability has not yet returned to pre-financial crisis levels. There are positive signs that the U.S. economy may improve this year -- including high stock prices, , and -- which could help boost U.S. workers' confidence in the stability of their jobs.
Most workers say they would quickly experience significant financial hardship if they lost their job, including 71% who would struggle financially in no more than four months. At the same time, Americans are more likely to say this year that their , which could give more workers a financial cushion if they were to lose their job.
Survey Methods
Results for this 优蜜传媒poll are based on telephone interviews conducted April 4-7, 2013, with a random sample of 499 adults, aged 18 and older employed full or part time, living in all 50 U.S. states and the District of Columbia.
For results based on the total sample of national adults employed full- or part-time, one can say with 95% confidence that the margin of sampling error is 卤6 percentage points.
Interviews are conducted with respondents on landline telephones and cellular phones, with interviews conducted in Spanish for respondents who are primarily Spanish-speaking. Each sample of national adults includes a minimum quota of 50% cellphone respondents and 50% landline respondents, with additional minimum quotas by region. Landline telephone numbers are chosen at random among listed telephone numbers. Cellphone numbers are selected using random digit dial methods. Landline respondents are chosen at random within each household on the basis of which member had the most recent birthday.
Samples are weighted to correct for unequal selection probability, nonresponse, and double coverage of landline and cell users in the two sampling frames. They are also weighted to match the national demographics of gender, age, race, Hispanic ethnicity, education, region, population density, and phone status (cellphone only/landline only/both, cellphone mostly, and having an unlisted landline number). Demographic weighting targets are based on the March 2012 Current Population Survey figures for the aged 18 and older U.S. population. Phone status targets are based on the July-December 2011 National Health Interview Survey. Population density targets are based on the 2010 census. All reported margins of sampling error include the computed design effects for weighting.
In addition to sampling error, question wording and practical difficulties in conducting surveys can introduce error or bias into the findings of public opinion polls.
View methodology, full question results, and trend data.
For more details on Gallup's polling methodology, visit .
