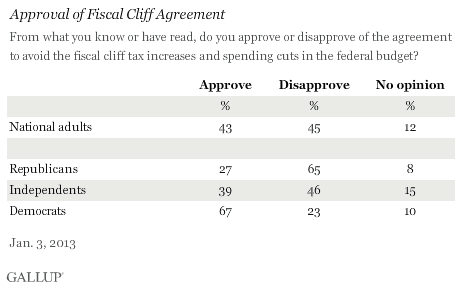
PRINCETON, NJ -- Americans have a decidedly mixed reaction to the "fiscal cliff" agreement reached by Congress and signed into law by President Barack Obama this week, with 43% saying they approve and 45% saying they disapprove. Two-thirds of Democrats approve of the agreement, while almost as many Republicans disapprove. Independents are slightly more likely to disapprove than approve.

These results are based on a one-day poll of 1,026 national adults conducted Thursday, Jan. 3, two days after the agreement was reached. The strong rank-and-file Republican opposition to the agreement appears to be in line with the opposition among Republican House members. The agreement was initially approved by a strong bipartisan vote of 89 to 8 in the Democratically controlled Senate, but passed by a much slimmer 257-167 margin in the Republican-controlled House, with 151 Republicans voting against it.
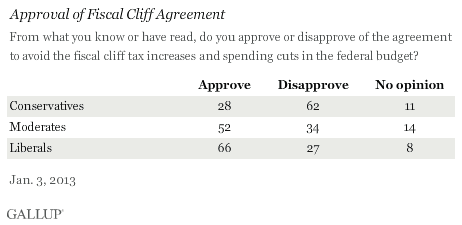
Attitudes toward the agreement are split along ideological lines, in a fashion parallel to the partisan differences. Liberals are highly likely to support the agreement, while conservatives oppose it. Moderates tilt toward approval of the agreement.

Obama and Biden Receive Highest Approval Ratings for Negotiations
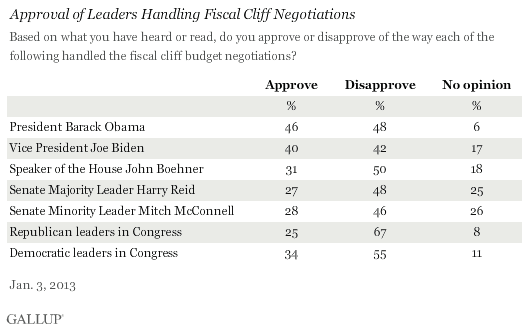
Americans generally are more negative than positive about the way in which federal government leaders handled the fiscal cliff negotiations, although President Obama and Vice President Joe Biden come close to breaking even. Americans give all of the other leaders tested significantly more negative evaluations.
Obama receives a 46% approval, 48% disapproval rating on his handling of the negotiations, and Biden receives virtually the same ratio of approval to disapproval (40% to 42%) albeit with a significantly higher "no opinion" percentage.
Americans' evaluations of the work of three congressional leaders include a net negative rating of -19 for Speaker of the House John Boehner, a net negative of -21 for Senate Majority Leader Harry Reid, and a net negative rating of -18 for Senate Minority Leader Mitch McConnell. Despite the fact that McConnell was more actively involved in the negotiations than either Reid or Boehner in the final days before the agreement was reached, McConnell's ratings are little different than those given to these other two men who had more prominent roles earlier in the negotiating process.
Americans are much more negative when asked to rate the generic "Republican leaders in Congress" than they are when asked to rate leaders listed by name or the generic "Democratic leaders in Congress." Sixty-seven percent of Americans disapprove of how Republican leaders handled the negotiations, with 25% approving, for a net negative rating of -42. The net negative rating accorded Democratic leaders is -21, essentially the same as given to Boehner, Reid, and McConnell.

Bottom Line
Although the last-minute agreement in Congress to forestall the fiscal cliff avoided what Americans perceived would be a very negative situation for the U.S. as a whole and , the American public is quite restrained in its reaction to the agreement. Slightly more Americans disapprove than approve, and Americans also give all leaders involved in the negotiations at least slightly more negative than positive evaluations for their work in arriving at an agreement. Still, Obama and Biden come out more positively on a relative basis than other leaders, as Obama did in being finalized.
Given that the agreement simply postponed discussion on possible big government spending cuts until the end of February, it is likely that Americans will be watching their leaders engage in more last-minute negotiations within just a couple of months.
Survey Methods
Results are based on telephone interviews conducted as part of the 优蜜传媒Daily tracking survey Jan. 3, 2013, with a random sample of 1,026 adults, aged 18 and older, living in all 50 U.S. states and the District of Columbia.
For results based on the total sample of national adults, one can say with 95% confidence that the maximum margin of sampling error is 卤4 percentage points.
Interviews are conducted with respondents on landline telephones and cellular phones, with interviews conducted in Spanish for respondents who are primarily Spanish-speaking. Each sample includes a minimum quota of 400 cellphone respondents and 600 landline respondents per 1,000 national adults, with additional minimum quotas among landline respondents by region. Landline telephone numbers are chosen at random among listed telephone numbers. Cellphone numbers are selected using random-digit-dial methods. Landline respondents are chosen at random within each household on the basis of which member had the most recent birthday.
Samples are weighted by gender, age, race, Hispanic ethnicity, education, region, adults in the household, and phone status (cellphone only/landline only/both, cellphone mostly, and having an unlisted landline number). Demographic weighting targets are based on the March 2011 Current Population Survey figures for the aged 18 and older non-institutionalized population living in U.S. telephone households. All reported margins of sampling error include the computed design effects for weighting and sample design.
In addition to sampling error, question wording and practical difficulties in conducting surveys can introduce error or bias into the findings of public opinion polls.
View methodology, full question results, and trend data.
For more details on Gallup's polling methodology, visit .
