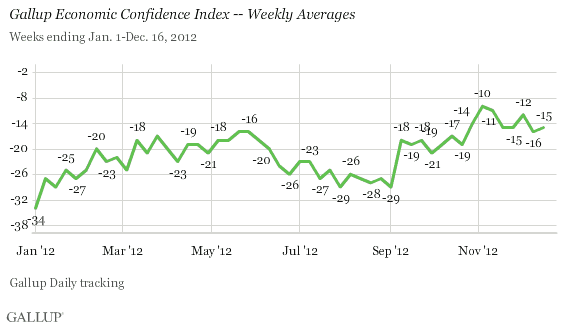
WASHINGTON, D.C. -- Americans' economic confidence held steady last week as U.S. lawmakers continued to negotiate how to avoid the so-called "fiscal cliff." Gallup's Economic Confidence Index was at -15 for the week ending Dec. 16, essentially unchanged from -16 the week prior and in the same general range that it has been for the past five weeks.

U.S. economic confidence has been moderately higher since the week ending Oct. 28, compared with the weeks from June until then, and the current weekly score remains one of the best of the year. The best two measures of 2012 came in the week before and after the U.S. presidential election, at -10 and -11, respectively. While that bump was not fully sustained, Americans' confidence has remained in the higher range, from -12 to -16, over the past five weeks amid the ongoing federal budget negotiations, suggesting some resilience amid uncertainty.
Currently, 17% of Americans say economic conditions in the country today are excellent or good and 38% say they are poor, for a current conditions score of -21, similar to the -20 of last week. Forty-three percent say the economy is getting better, while 52% say it is getting worse, for an economic outlook score of -9, little changed from -11 last week. The economic outlook component is responsible for the majority of the decline in the overall index score in recent weeks. Both components are down compared with early November but up compared with the summer months and this week a year ago.

Republicans registered a measurable increase in their economic confidence last week, to -54 from -62, as House Speaker John Boehner engaged in talks with President Barack Obama to reach a deal that would balance Republicans' preference for spending cuts with the president's preference for higher tax rates on the wealthiest Americans. Over the same period, independents and Democrats became slightly more negative in their economic confidence, offsetting the improvement among Republicans. Nonetheless, Republicans' economic ratings remain far more negative than Democrats' and independents', as they have been throughout President Obama's term.

Bottom Line
Americans are holding on to their current views of the economy as the president and leaders in Congress wrangle over the specifics of a federal budget that will no doubt affect many Americans no matter what they decide. This is despite the fact that the majority of Americans think it will if the fiscal cliff tax increases and spending cuts go into effect.
The steadiness in economic views over the past five weeks is likely the combination of various factors. Americans may simply be waiting to see the result of the negotiations before adjusting their views on the economy, as before the Jan. 1 deadline. Alternately, they may have already factored this debate into their economic assessment, balancing it with other economic and political news.
Whatever the reason, it may be a good sign that economic confidence has not deteriorated more amid the highly publicized fiscal cliff talks. Still, it is likely these views will break out of their current holding pattern if leaders strike a deal -- or if they do not. Americans' economic views post-fiscal cliff will either build or erase the gains seen in late 2012 and set the benchmark for economic attitudes in 2013.
Gallup.com reports results from these indexes in daily, weekly, and monthly averages and in Gallup.com stories. Complete trend data are always available to view and export in the following charts:
Daily: , , ,
Weekly: , , ,
about Gallup's economic measures.
our economic release schedule.
Survey Methods
Results are based on telephone interviews conducted as part of the 优蜜传媒Daily tracking survey Dec. 10-16, 2012, with a random sample of 3,437 adults, aged 18 and older, living in all 50 U.S. states and the District of Columbia, selected using random-digit-dial sampling.
For results based on the total sample of national adults, one can say with 95% confidence that the maximum margin of sampling error is 卤1 percentage point.
Interviews are conducted with respondents on landline telephones and cellular phones, with interviews conducted in Spanish for respondents who are primarily Spanish-speaking. Each sample includes a minimum quota of 400 cellphone respondents and 600 landline respondents per 1,000 national adults, with additional minimum quotas among landline respondents by region. Landline telephone numbers are chosen at random among listed telephone numbers. Cellphone numbers are selected using random-digit-dial methods. Landline respondents are chosen at random within each household on the basis of which member had the most recent birthday.
Samples are weighted by gender, age, race, Hispanic ethnicity, education, region, adults in the household, and phone status (cellphone only/landline only/both, cellphone mostly, and having an unlisted landline number). Demographic weighting targets are based on the March 2011 Current Population Survey figures for the aged 18 and older non-institutionalized population living in U.S. telephone households. All reported margins of sampling error include the computed design effects for weighting and sample design.
In addition to sampling error, question wording and practical difficulties in conducting surveys can introduce error or bias into the findings of public opinion polls.
For more details on Gallup's polling methodology, visit .
