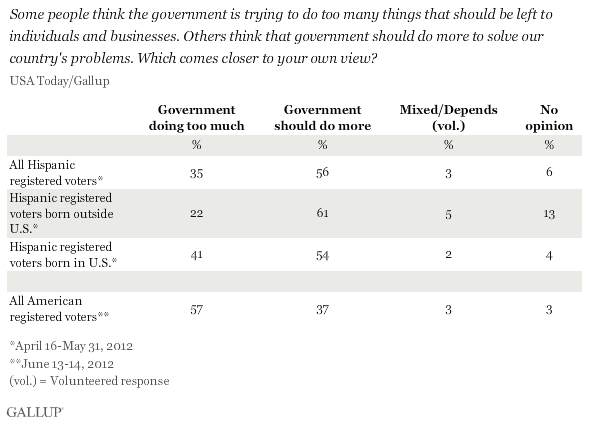
PRINCETON, NJ -- The majority (56%) of Hispanic registered voters in the U.S. believe the government should "do more to solve our country's problems." This is more than the 37% of all American registered voters who say the same. Hispanic voters born outside the U.S. are even more likely to favor government intervention than those born in the U.S.

These attitudes were measured as part of a USA Today/���۴�ýanalysis of the , based on questions included in ���۴�ýDaily tracking April 16-May 31 with 1,005 Hispanic registered voters in all 50 U.S. states and the District of Columbia. The same questions were asked of 859 American registered voters in ���۴�ýDaily tracking June 13-14.
Hispanic voters who were not born in the U.S. differ most from the views of all Americans. Hispanic voters not born in this country tilt by 61% to 22% toward the view that government should be more involved in solving problems, with almost one in five not having an opinion either way. Hispanic voters who were U.S.-born are more evenly split, with 54% saying government should do more and 41% saying the government is doing too much.
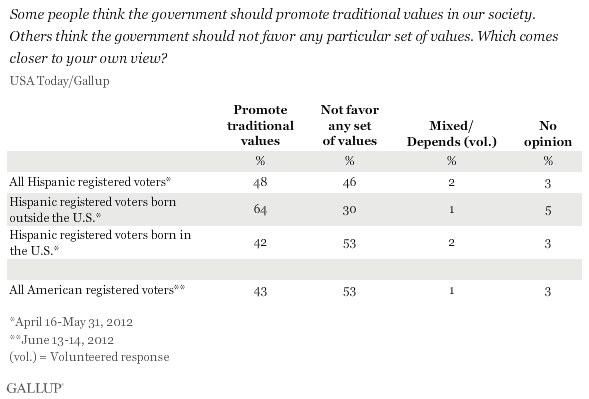
Although they believe that government should do more to solve problems, Hispanic voters are divided about whether the government should (48%) or should not (46%) promote traditional values in U.S. society. Hispanic voters who were not born in this country are the most likely to want the government to promote traditional values -- whereas those born in the U.S. express views similar to those the rest of Americans hold.

Implications
Hispanic voters on average -- whether or not they were born in the U.S. -- are more likely than the average American voter to believe the government should play a role in solving problems in American society. Hispanic voters are also slightly more likely than all voters to say the government should promote traditional values in society -- but this is driven entirely by the views of Hispanic voters born outside the U.S.
These views reflect in part the fact that Hispanics are significantly more likely than average to identify with the Democratic Party -- and that Democrats overall are strongly more likely to favor an interventionist role of government than are Republicans. On the other hand, Hispanics may choose to identify with the Democratic Party because they agree with its positions.
Hispanics do not by any means totally mirror the Democratic position on this issue, however. Sixty-seven percent of all Democrats favor the government's doing more to solve problems, while fewer Hispanics say the same -- and even fewer of those who were born in the U.S.
In general, the results underscore the challenge Mitt Romney faces in reaching Hispanic voters, given that this group tilts toward government-involvement policies that are at odds with Romney's overall philosophy and GOP policy positions. Still, Hispanics born in this country are somewhat less in favor of government involvement than are Democrats as a whole, suggesting that there may be an opening on this issue for Republicans now or in the future. Additionally, Hispanic immigrants seem to care about traditional values, which could provide an opening for conservative candidates like Romney as well.
Survey Methods
Results for this USA Today/���۴�ýpoll of Hispanics are based on telephone interviews conducted April 16-May 31, 2012 on the ���۴�ýDaily tracking survey, with a random sample of 1,005 registered voters who identify as Hispanic, aged 18 and older, living in all 50 U.S. states and the District of Columbia.
For results based on the sample of 1,005 Hispanic registered voters, one can say with 95% confidence that the margin of error is ±4 percentage points.
National adult results are based on telephone interviews conducted June 13-14, 2012, on the ���۴�ýDaily tracking survey, with a random sample of 859 U.S. registered voters, one can say with 95% confidence that the margin of error is ±4 percentage points.
Interviews are conducted with respondents on landline telephones and cellular phones, with interviews conducted in Spanish for respondents who are primarily Spanish-speaking. Each sample includes a minimum quota of 400 cell phone respondents and 600 landline respondents per 1,000 national adults, with additional minimum quotas among landline respondents by region. Landline telephone numbers are chosen at random among listed telephone numbers. Cell phone numbers are selected using random-digit-dial methods. Landline respondents are chosen at random within each household on the basis of which member had the most recent birthday.
Samples are weighted by gender, age, race, Hispanic ethnicity, education, region, adults in the household, and phone status (cell phone only/landline only/both, cell phone mostly, and having an unlisted landline number). Demographic weighting targets are based on the March 2011 Current Population Survey figures for the aged 18 and older non-institutionalized population living in U.S. telephone households. All reported margins of sampling error include the computed design effects for weighting and sample design.
In addition to sampling error, question wording and practical difficulties in conducting surveys can introduce error or bias into the findings of public opinion polls.
For more details on Gallup's polling methodology, visit .
