WASHINGTON, D.C. -- While the vast majority of Americans express satisfaction about the community or area where they live, residents of some metro areas are highly optimistic about where their community is headed, whereas residents of other communities are largely discouraged. Across 190 U.S. metro areas, residents of Provo-Orem, Utah, are the most likely nationwide to say their city or area is getting better as a place to live (76%), while residents of Binghamton, N.Y., are the least likely to say this (27.8%).
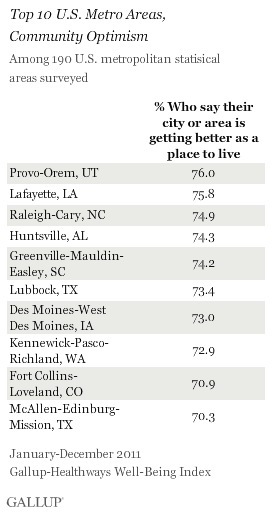
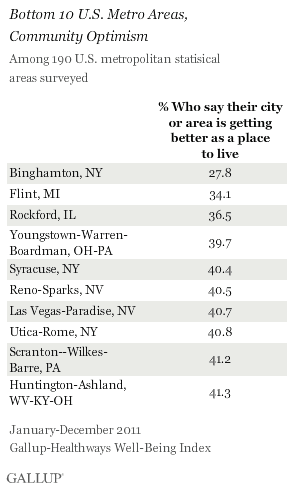
The tracks community satisfaction and optimism on a daily basis. Results reported in this article reflect the average for 2011 based on interviews with 353,492 U.S. adults conducted from January to December 2011.
The results do not paint a clear picture of what makes a metro area optimistic. Provo-Orem enjoys a below-average unemployment rate of 5.3%, according to the U.S. Bureau of Labor Statistics, and has been among the for four years straight.
McAllen-Edinburg-Mission, Texas, however, also makes the top 10 with an above average unemployment rate of 11.2% and the .
Further, among the 10 most optimistic metro areas, only a trio -- Provo-Orem, Raleigh-Cary, N.C., and Des Moines-West Des Moines, Iowa -- also make the top 10 in overall city satisfaction. That is to say, the most optimistic metro areas are not necessarily those where residents are currently among the most satisfied with their city or area as a place to live.
There is also a much smaller range in overall current community satisfaction, , than there is in community optimism. Residents of Lancaster, Pa., (94.7%) are the most satisfied with their city or area as a place to live, while residents of Flint, Mich., are the least satisfied (70.2%).
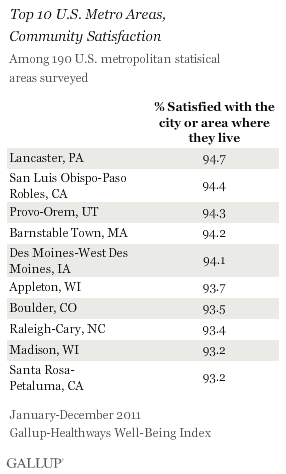
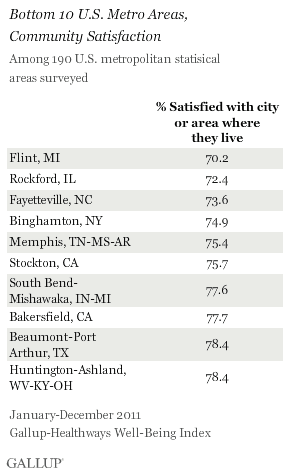
Some metro areas have the difficult combination of relatively low satisfaction and low optimism. Binghamton, Flint, Rockford, Ill., and Huntington-Ashland, W.Va., rank in the bottom 10 of both metrics. More broadly, 47 of these 190 U.S. metro areas find less than half of the population optimistic about where the community is headed.
Raleigh-Cary, N.C., Is Most Optimistic Among Large Metro Areas
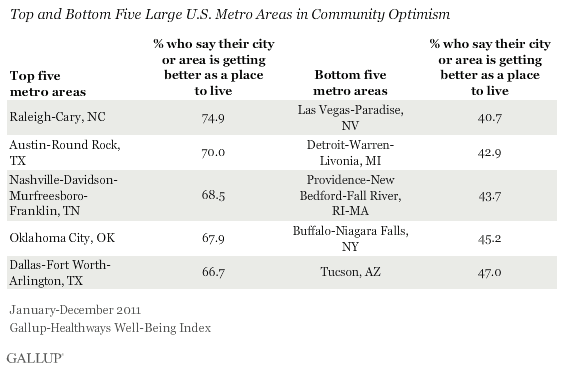
Among large metro areas, residents in Raleigh-Cary, N.C., are the most optimistic about the future of their communities, followed by residents of Austin-Round Rock, Texas, and those in the Nashville, Tenn., metro area. On the flip side, residents of the metro areas near Las Vegas, Detroit, and Providence are the least optimistic.
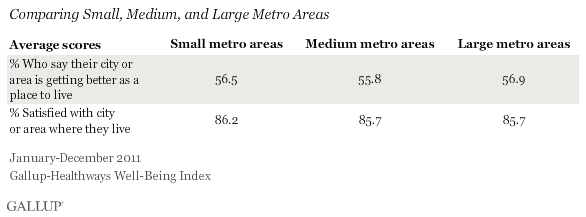
Overall, community satisfaction and optimism do not appear to be related to the size of the metro area. Small, medium, and large metro areas, on average, have similar levels of satisfaction and optimism.
Implications
The Gallup-Healthways data on city optimism highlight the different dynamics that currently exist in metro areas across the country. While U.S. residents everywhere tend to rate their communities well, residents in some metros are more likely to see something happening in their areas that makes them highly optimistic about them as a place to live, while others are highly pessimistic about the outlook for their communities.
Seven out of the 10 most optimistic U.S. metro areas appear among the top 25 metro areas on the Milken Institute's for 2011, which ranks U.S. metropolitan areas based on a combination of employment, salary, and technology growth statistics. This suggests that the Gallup-Healthways optimism measure is picking up some of this positive traction. The broader community satisfaction metric does not appear to do the same, as Madison, Wis., is the only metro area among Gallup's top 10 most satisfied that also appears on the Milken Institute's Best-Performing Cities Index for 2011.
Together, the data suggest there is likely a combination of factors that can create optimism about a community. The best performing cities in this area may provide best practice examples for others to follow. Leaders who are able to achieve such optimism about where their community is headed have the opportunity to channel that positive energy into a community's economic and social infrastructure, in turn, creating the types of good jobs that help cities thrive. Alternately, communities in which residents lack optimism risk losing the very talent and energy they need to rise again.
About the Gallup-Healthways Well-Being Index
The Gallup-Healthways Well-Being Index tracks well-being in the U.S., U.K., and Germany and provides best-in-class solutions for a healthier world. To learn more, please visit .
Survey Methods
Results are based on telephone interviews conducted as part of the Gallup-Healthways Well-Being Index survey Jan. 2-Dec. 29, 2011, with a random sample of 353,492 adults, aged 18 and older, living in all 50 U.S. states and the District of Columbia, selected using random-digit-dial sampling.
The metro areas referenced in this article are based on the Metropolitan Statistical Areas (MSAs) as defined by the U.S. Office of Management and Budget. In many cases, more than one city is included in the same MSA. The San Jose, Calif., metropolitan statistical area, for example, also includes the smaller nearby cities of Sunnyvale and Santa Clara in addition to San Jose itself. Each respondent is attributed to his or her MSA based on the self-report of his or her ZIP code, and all metro areas had at least 300 completed surveys in 2011.
Maximum expected error ranges for the MSAs vary according to size, ranging from less than 1 percentage point for the largest cities represented to 卤6.5 percentage points for the smallest cities.
Interviews are conducted with respondents on landline telephones and cellular phones, with interviews conducted in Spanish for respondents who are primarily Spanish-speaking. Each sample includes a minimum quota of 400 cell phone respondents and 600 landline respondents per 1,000 national adults, with additional minimum quotas among landline respondents by region. Landline telephone numbers are chosen at random among listed telephone numbers. Cell phone numbers are selected using random-digit-dial methods. Landline respondents are chosen at random within each household on the basis of which member had the most recent birthday.
Samples are weighted by gender, age, race, Hispanic ethnicity, education, region, adults in the household, and phone status (cell phone only/landline only/both, cell phone mostly, and having an unlisted landline number). Demographic weighting targets are based on the March 2010 Current Population Survey figures for the aged 18 and older non-institutionalized population living in U.S. telephone households. All reported margins of sampling error include the computed design effects for weighting and sample design.
In addition to sampling error, question wording and practical difficulties in conducting surveys can introduce error or bias into the findings of public opinion polls.
For more details on Gallup's polling methodology, visit .
