PRINCETON, NJ -- Americans say they want Barack Obama (46%) rather than the Republicans in Congress (42%) to have more influence over the direction the nation takes in the next year. U.S. preferences have been closely divided on this question since early 2011, after Republicans won a majority in the House of Representatives, but Obama has consistently had a slim advantage, suggesting a real lead for him. Prior to 2011, Americans favored congressional Republicans.
![2010-2011 Trend: Who do you want to have more influence over the direction the nation takes in the next year -- [ROTATED: Barack Obama (or) the Republicans in Congress]?](http://content.gallup.com/origin/gallupinc/GallupSpaces/Production/Cms/POLL/t_-avvomxe6w8yfssoot6q.gif)
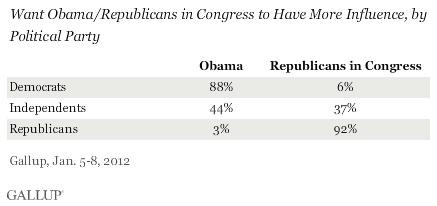
These results are based on a Jan. 5-8 ���۴�ýpoll. In general, Democrats want Obama to have more influence and Republicans want the Republicans in Congress to have more influence. Independents are more likely to prefer Obama.

���۴�ýasked a similar question in both the George W. Bush and the Bill Clinton administrations. Typically, Americans prefer that the president have more influence than the opposing party in Congress.
However, that has not always been the case. In the first year after Republicans took control of both houses of Congress in 1995, Americans generally wanted the GOP Congress to have more influence than Clinton. But starting in about April 1996, Americans' preferences shifted more toward Clinton, where they remained for the rest of his presidency.
![1995-1999 Trend: Who do you want to have more influence over the direction the nation takes in the next year -- [ROTATED: Bill Clinton (or) the Republicans in Congress]?](http://content.gallup.com/origin/gallupinc/GallupSpaces/Production/Cms/POLL/nk4yq5c_xuinv1_nmrqwhw.gif)
During the latter years of Bush's presidency, when he suffered from low approval ratings, Americans wanted the Democrats in Congress to have more influence by roughly 2-to-1 margins.
![2001-2007 Trend: Who do you want to have more influence over the direction the nation takes in the next year -- [ROTATED: George W. Bush (or) the Democrats in Congress]?](http://content.gallup.com/origin/gallupinc/GallupSpaces/Production/Cms/POLL/uk3wuvmxhuosbxfufnyfig.gif)
Neither Obama nor Congress Held in High Esteem Now
The choice of who should have more influence may not be easy for Americans, since they hold neither Obama nor Congress in very high regard at the moment. Obama's latest in ���۴�ýDaily tracking is 43%. The last time ���۴�ýmeasured specifically, in September, it was 26%, just one percentage point above the historical low.
More broadly, 13% of Americans currently approve of Congress overall, according to the Jan. 5-8 poll. That is tied for the second-lowest congressional approval rating ���۴�ýhas measured since it first asked the question in 1974, behind .
Republicans (14%), Democrats (14%), and independents (11%) are about equally negative toward Congress.
Implications
Given a choice, Americans are fairly evenly divided in their preferences for whether President Obama or the Republicans in Congress should have more influence over the course of the nation during the next year, with Obama having a slight edge.
Obama's slightly better positioning is consistent with the president's usual advantage on this question, with Americans generally preferring the opposition party in Congress only when the president is highly unpopular. Obama is certainly not popular at the moment, but on a relative basis he is more popular than the Republicans in Congress.
Survey Methods
Results for this ���۴�ýpoll are based on telephone interviews conducted Jan. 5-8, 2012, with a random sample of 1,011 adults, aged 18 and older, living in all 50 U.S. states and the District of Columbia.
For results based on the total sample of national adults, one can say with 95% confidence that the maximum margin of sampling error is ±4 percentage points.
Interviews are conducted with respondents on landline telephones and cellular phones, with interviews conducted in Spanish for respondents who are primarily Spanish-speaking. Each sample includes a minimum quota of 400 cell phone respondents and 600 landline respondents per 1,000 national adults, with additional minimum quotas among landline respondents by region. Landline telephone numbers are chosen at random among listed telephone numbers. Cell phone numbers are selected using random-digit-dial methods. Landline respondents are chosen at random within each household on the basis of which member had the most recent birthday.
Samples are weighted by gender, age, race, Hispanic ethnicity, education, region, adults in the household, and phone status (cell phone only/landline only/both, cell phone mostly, and having an unlisted landline number). Demographic weighting targets are based on the March 2011 Current Population Survey figures for the aged 18 and older non-institutionalized population living in U.S. telephone households. All reported margins of sampling error include the computed design effects for weighting and sample design.
In addition to sampling error, question wording and practical difficulties in conducting surveys can introduce error or bias into the findings of public opinion polls.
View methodology, full question results, and trend data.
For more details on Gallup's polling methodology, visit .
