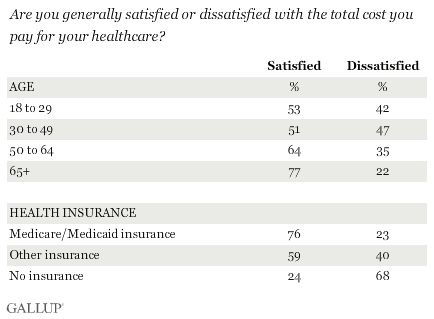
PRINCETON, NJ -- Six in 10 Americans are satisfied with the total cost they pay for their healthcare, with satisfaction significantly higher among older Americans and those who have Medicare or Medicaid insurance.

These results are based on Gallup's annual Health and Healthcare survey, conducted each November since 2001.
Slightly more than half of 18- to 29-year-olds -- -- are satisfied with what they pay for healthcare. More than three-quarters of those 65 and older, most of whom have government-funded Medicare, are satisfied.
Americans' overall level of satisfaction with what they pay for their healthcare has generally been stable over the last decade, ranging between 54% in November 2006 and 64% in November 2001. For the last five years, satisfaction with personal healthcare costs has varied only slightly, between 57% and 62%.

Americans' relatively high level of satisfaction with the total cost of their personal healthcare contrasts with their low satisfaction, , with the total cost of healthcare in this country.
The disparity between Americans' high level of satisfaction with their personal healthcare costs and their views of healthcare costs nationwide is representative of a general phenomenon in which the public rates local situations more positively than national situations. For example, Americans are than about Congress in general. The same applies to Americans' views of and .
Most Americans Say Their Cost of Health Insurance Has Gone Up
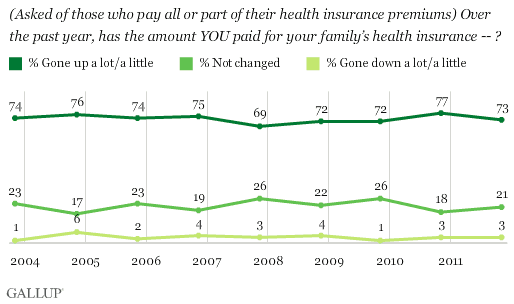
Despite the relatively high levels of overall satisfaction with what they pay for healthcare, most Americans continue to say the amount they pay for their family's health insurance has gone up either a little (44%) or a lot (29%) over the past year. Americans have given similar responses to this question since it was first asked in 2003.

Two in 10 Have Put Off Treatment for Serious Medical Condition Because of Costs
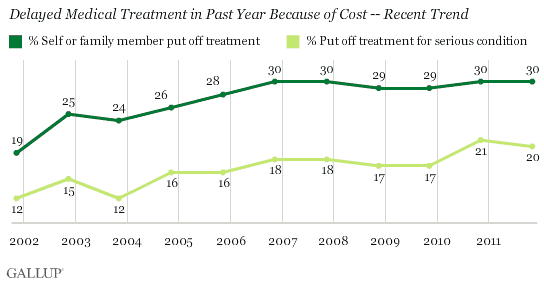
Perhaps the most extreme response to healthcare costs occurs when someone decides to delay or not pursue treatment because of the cost. Three in 10 Americans report that they put off medical treatment within the last 12 months because of its cost. This percentage increased from 19% in 2001 to 30% in 2007, and has been at or near the 30% level since. A follow-up question shows that the majority of these postponements of treatment were for a serious condition or illness, with the net result that overall, 20% of Americans say they postponed treatment for something serious.

Bottom Line
Americans name the cost of healthcare, along with access to healthcare, as the two most urgent health problems facing the country, and only . But Americans appear , and a majority, particularly older Americans, appear to be satisfied with what they pay for healthcare.
As evidenced by its name, the Patient Protection and Affordable Care Act of 2010 was designed at least partly to ameliorate healthcare costs. There is little sign so far in Gallup's trend data that Americans recognize any significant change in their healthcare cost situation. This is perhaps not surprising because many of the provisions of the Affordable Care Act have yet to be enacted. Future research will be needed to monitor whether that goal has been successfully reached from the average American's perspective.
Survey Methods
Results for this 优蜜传媒poll are based on telephone interviews conducted Nov. 3-6, 2011, with a random sample of 1,012 adults, aged 18 and older, living in all 50 U.S. states and the District of Columbia.
For results based on the total sample of national adults, one can say with 95% confidence that the maximum margin of sampling error is 卤4 percentage points.
Interviews are conducted with respondents on landline telephones and cellular phones, with interviews conducted in Spanish for respondents who are primarily Spanish-speaking. Each sample includes a minimum quota of 400 cell phone respondents and 600 landline respondents per 1,000 national adults, with additional minimum quotas among landline respondents by region. Landline telephone numbers are chosen at random among listed telephone numbers. Cell phone numbers are selected using random-digit-dial methods. Landline respondents are chosen at random within each household on the basis of which member had the most recent birthday.
Samples are weighted by gender, age, race, Hispanic ethnicity, education, region, adults in the household, and phone status (cell phone only/landline only/both, cell phone mostly, and having an unlisted landline number). Demographic weighting targets are based on the March 2010 Current Population Survey figures for the aged 18 and older non-institutionalized population living in U.S. telephone households. All reported margins of sampling error include the computed design effects for weighting and sample design.
In addition to sampling error, question wording and practical difficulties in conducting surveys can introduce error or bias into the findings of public opinion polls.
View methodology, full question results, and trend data.
For more details on Gallup's polling methodology, visit .
