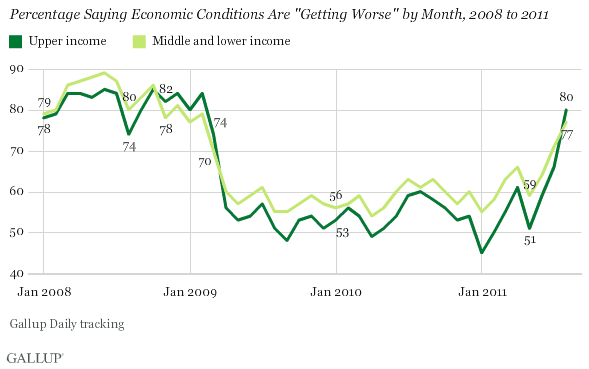
PRINCETON, NJ -- Upper-income Americans' economic confidence was badly shaken in August, with 80% saying the economy is "getting worse," up from 66% in July. This is the first month since the financial crisis of late 2008 and early 2009 that upper-income Americans are more pessimistic about the future direction of the U.S. economy than other Americans.

Normally, upper-income Americans tend to be more optimistic about the future of the economy than those with lower incomes. Additionally, the percentage of upper-income Americans expressing concerns about the future direction of the economy is the highest it has been since February 2009.
Middle- and lower-income Americans' outlook also deteriorated in August, with 77% saying the economy is "getting worse." This is up from 71% in July and its highest level since February 2009.
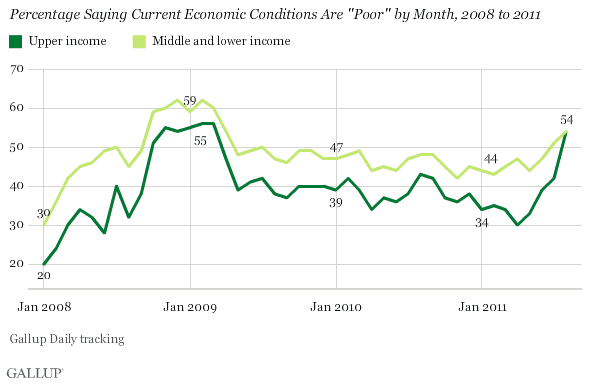
More Upper-Income Americans Rating the Economy "Poor"
Fifty-four percent of upper-income Americans rate current economic conditions "poor" in August, up from 42% in July. This is the highest percentage providing this rating since March 2009.

Fifty-four percent of middle- and lower-income Americans also rate current economic conditions poor in the August, up from 51% in July and the highest since April 2009.
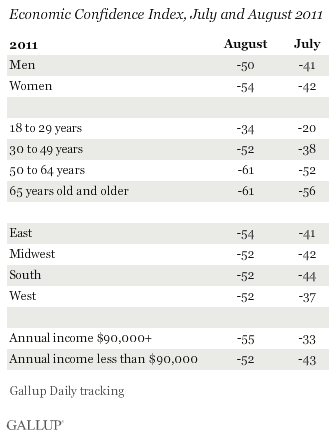
Gallup's Economic Confidence Index, which combines the prior two measures, plummeted among upper-income Americans in August to -55, from -33 in July. The index fell to -52 among middle- and lower-income Americans. Economic Confidence Index scores for both income groups have now sunk to their lowest levels since February 2009.

Gallup's Economic Confidence Index fell to -52 nationally in August, down sharply from -42 in July. The overall index is at its .
Upper-Income Americans' Lack of Confidence Reason for Concern
Upper-income Americans' sharp decline in optimism about the future direction of the economy may be related in part to the volatility on Wall Street, concerns about the federal deficit, the lack of new action by the Fed, and growing concerns about a European financial crisis. Like all other Americans, those with higher incomes tend to be concerned about high unemployment rates, increasing job insecurity, high food and energy prices, and a general lack of confidence in the government's ability to help improve the economy. The sharp decline in upper-income Americans' confidence may also reflect a growing realization among corporate managers and small-business owners -- who tend to be in the higher-income group -- that the U.S. economy is going to experience slow growth, at best, during the second half of 2011.
Whatever its source, repeating the unusual situation in which upper-income Americans are more pessimistic than their middle- and lower-income counterparts may be reason for concern. This is reminiscent of what happened during the financial crisis: upper-income Americans sharply pulled back on their spending, making the recession worse. Upper-income Americans tend to have the disposable income to spend even when other Americans do not. If they reduce their spending going forward, it increases the chances of a double-dip recession.
On a more positive note, Gallup's Economic Confidence measure improved modestly nationwide during the first two weeks of September -- more during the holiday week than the week that followed. While such a modest improvement in perceptions tends to be normal following a holiday, any improvement in how consumers feel about the economy is helpful at this point.
See complete demographic data on page 2.
Gallup.com reports results from these indexes in daily, weekly, and monthly averages and in Gallup.com stories. Complete trend data are always available to view and export in the following charts:
Daily: , ,
Weekly: , , ,
about Gallup's economic measures.
our economic release schedule.
Survey Methods
Results are based on telephone interviews conducted as part of 优蜜传媒Daily tracking August 2011, with a random sample of 15,001 adults, aged 18 and older, living in all 50 U.S. states and the District of Columbia.
For results based on the total sample of national adults, one can say with 95% confidence that the maximum margin of sampling error is 卤3 percentage points.
Interviews are conducted with respondents on landline telephones and cellular phones, with interviews conducted in Spanish for respondents who are primarily Spanish-speaking. Each sample includes a minimum quota of 400 cell phone respondents and 600 landline respondents per 1,000 national adults, with additional minimum quotas among landline respondents by region. Landline telephone numbers are chosen at random among listed telephone numbers. Cell phone numbers are selected using random-digit-dial methods. Landline respondents are chosen at random within each household on the basis of which member had the most recent birthday.
Samples are weighted by gender, age, race, Hispanic ethnicity, education, region, adults in the household, and phone status (cell phone only/landline only/both, cell phone mostly, and having an unlisted landline number). Demographic weighting targets are based on the March 2010 Current Population Survey figures for the aged 18 and older non-institutionalized population living in U.S. telephone households. All reported margins of sampling error include the computed design effects for weighting and sample design.
In addition to sampling error, question wording and practical difficulties in conducting surveys can introduce error or bias into the findings of public opinion polls.
For more details on Gallup's polling methodology, visit .

