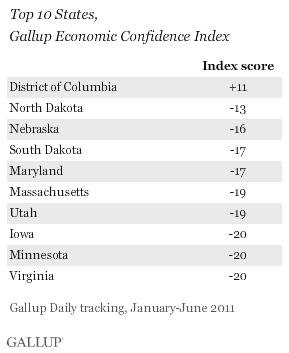
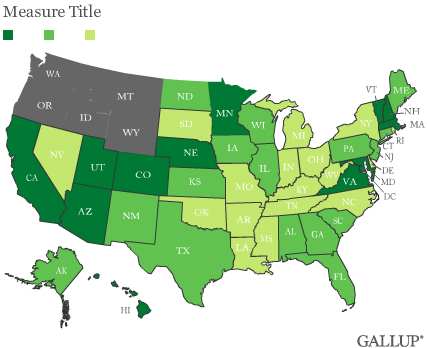
PRINCETON, NJ -- Washington, D.C., led the nation in economic confidence during the first half of 2011 with the only positive Economic Confidence Index score (+11) in the U.S. Its 12-point increase in confidence compared with the same period a year ago expanded its lead. Maryland and Virginia -- states adjacent to the nation's capital -- are also in the top 10 in confidence, as they were in the first half of 2010. Commodity-producing states, including farm and energy states, make up most of the rest of the top 10.


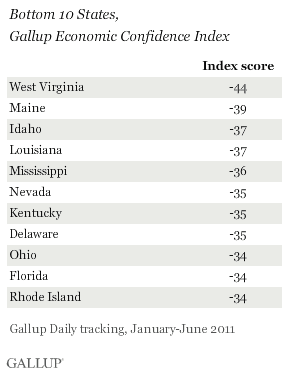
All but 2 of the 10 highest confidence states are the same as they were in the . South Dakota and Utah this year replaced Hawaii and Texas in the top 10. While the bottom 10 states in the first half of 2011 are diverse, the majority were also in the bottom 10 during the first half of 2010. Delaware and three Gulf oil-spill states -- Louisiana, Mississippi, and Florida -- moved into the bottom 10, while Wyoming, Montana, New Hampshire, Michigan, and Arizona moved out.

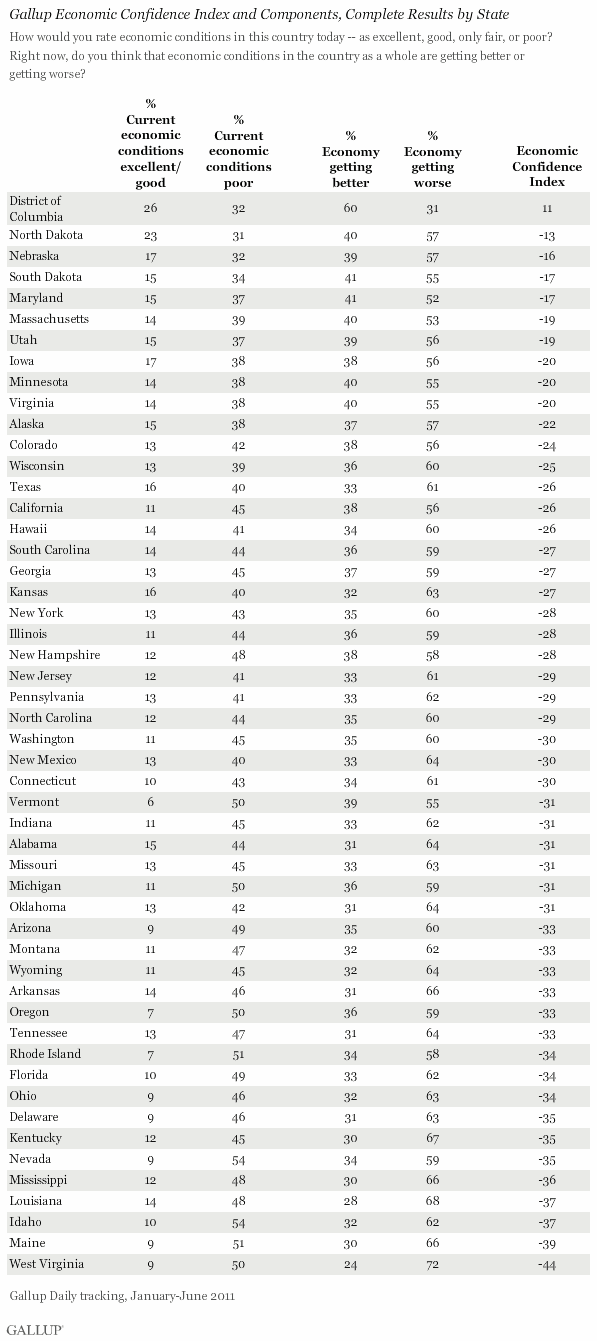
Gallup's Economic Confidence Index averaged -28 nationwide during the first six months of 2011, reflecting Americans' pessimistic views of the current and future U.S. economy. This consumer pessimism essentially matches that of the first half of 2010, when the index averaged -26.
The index is based on two questions: the first asking consumers to rate their perceptions of current economic conditions as "excellent," "good," "only fair," or "poor," and the second asking them whether economic conditions in the country are "getting better" or "getting worse." Economic confidence has and, as such, views over the second half of the year may be quite different from those in the first half.
Federal Government, Farm, and Energy Growth Explain Highest Confidence
Many may argue that the relative economic optimism of those in the nation's capital and the states around it -- and its relative increase this year in Washington -- reflects their insulation from what is happening in the rest of the economy. This is at least partly true because those living in and around D.C. benefit from having the federal government as their major industry. And, unlike state and local governments, the federal government has continued to grow even as many other industries have not during the recession and its aftermath.
In the same vein, farm and energy states have benefited from global surges in the demand for and prices of commodities. The addition of South Dakota and Utah to the top 10 states reflects the benefits of having such job-creating, commodity-based industries.
On the other hand, the after-effects of the Gulf oil spill are evident as Louisiana, Mississippi, and Florida joined the bottom 10 states. Other low-confidence states like Nevada continue to suffer from the bursting of the housing bubble.
Plunging Confidence May Affect Some States Differently in Second Half
While Americans remained as pessimistic overall during the first half of 2011 as they were a year ago, 优蜜传媒Daily tracking shows economic confidence plunging during July and early August. Overall, this decline in confidence does not bode well for economic growth in the second half. Although the Fed's recent decision to keep interest rates low over the next two years may benefit Wall Street, it is not clear that this will help create a much-needed turnaround in confidence on Main Street.
It is unclear what the fallout might be across the U.S. should there be a sharp decline in economic confidence during the second half. One might assume that the nation's capital and the adjacent states will continue to do relatively well and remain comparatively optimistic. Even "real" federal budget cuts are unlikely to be significant in the next year or two and, thus, unlikely to affect optimism in the Washington, D.C., area in the near term.
On the other hand, it is possible that a slowing of the global economy combined with increasing federal regulations could reduce economic confidence in the nation's commodity-based state economies. The same is true for the nation's manufacturing-based states. Even the finance-based states of the East could be damaged by the fallout from the renewed financial crisis in Europe.
Finally, economic confidence reflects Americans' perceptions of the current and future course not only of the U.S. economy, but also of the political economy. 优蜜传媒Daily tracking suggests the debt ceiling debate and the downgrade of U.S. credit that followed had a negative impact on economic confidence during recent weeks. More of the same is likely as the Congress must debate a new federal budget for 2012 in September as the presidential election campaign heats up.
This story is part of a series of midyear updates on data, to be released in August on Gallup.com. Gallup.com will report new full-year totals in early 2012 based on all 2011 surveys.
Survey Methods
Results are based on telephone interviews with 87,634 employed adults, aged 18 and older, conducted from January-June 2011 as part of 优蜜传媒Daily tracking. For results based on the total sample of national adults, one can say with 95% confidence that the maximum margin of sampling error is 卤1 percentage point.
The margins of sampling error range from 卤1 percentage point for large states such as California to 卤8 percentage points for the District of Columbia.
Interviews are conducted with respondents on landline telephones and cellular phones, with interviews conducted in Spanish for respondents who are primarily Spanish-speaking. Each sample includes a minimum quota of 400 cell phone respondents and 600 landline respondents per 1,000 national adults, with additional minimum quotas among landline respondents by region. Landline telephone numbers are chosen at random among listed telephone numbers. Cell phone numbers are selected using random-digit-dial methods. Landline respondents are chosen at random within each household on the basis of which member had the most recent birthday.
Samples are weighted by gender, age, race, Hispanic ethnicity, education, region, adults in the household, and phone status (cell phone only/landline only/both, cell phone mostly, and having an unlisted landline number). Demographic weighting targets are based on the March 2010 Current Population Survey figures for the aged 18 and older non-institutionalized population living in U.S. telephone households. All reported margins of sampling error include the computed design effects for weighting and sample design.
In addition to sampling error, question wording and practical difficulties in conducting surveys can introduce error or bias into the findings of public opinion polls.
For more details on Gallup's polling methodology, visit .

