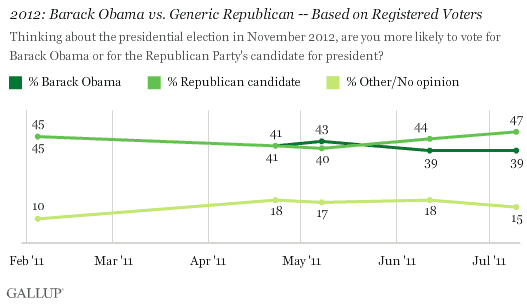
PRINCETON, NJ -- Registered voters by a significant margin now say they are more likely to vote for the "Republican Party's candidate for president" than for President Barack Obama in the 2012 election, 47% to 39%. Preferences had been fairly evenly divided this year in this test of Obama's re-election prospects.

The latest results are based on a July 7-10 poll, and show that the Republican has an edge for the second consecutive month. Obama held a slight edge in May, when his approval rating increased after the death of Osama bin Laden. As his rating has come back down during the last two months, so has his standing on the presidential "generic ballot."
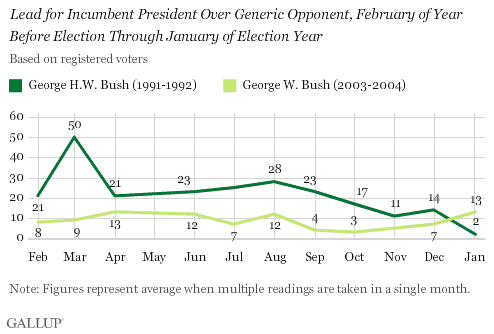
ÆéûÜǨû§typically uses this question format when a president is seeking re-election but his likely opponent is unknown, as was the case in 1991-1992 and 2003-2004, when incumbents George H.W. Bush and George W. Bush, respectively, were seeking re-election.
The elder Bush held large leads over his generic Democratic opponent throughout 1991, but early 1992 preferences were more evenly divided and Bush eventually lost his re-election bid. The younger Bush also consistently maintained at least a small advantage over the Democrat throughout 2003, before winning re-election in a close contest in November 2004.

Thus, the results more than a year ahead of the election do not have a large degree of predictive ability, and underscore that things can change greatly in the final year or more before an election.
Both Bushes had higher job approval ratings in the year before their re-election contests than Obama does now, helping explain why Obama has fared less well on the generic ballot in the year prior to the election year. George H.W. Bush's approval rating in July 1991 averaged 71%, while George W. Bush's July 2003 average was 60%. Obama's latest weekly average is 46%.
Obama Trailing Among Independent Voters
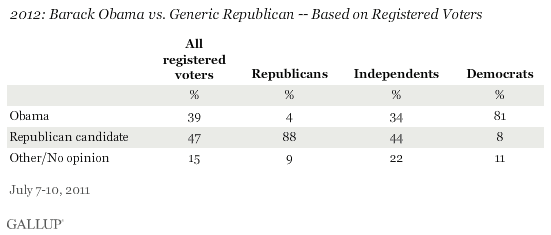
Independent registered voters are currently more likely to vote for the Republican candidate (44%) than for Obama (34%), though one in five do not have an opinion. Republicans and Democrats show strong party loyalty in their vote choices, with Republicans showing somewhat stronger loyalty.

Independents' preferences are similar to , while Republicans' support for the Republican candidate has increased slightly.
Implications
President Obama's re-election prospects do not look very favorable at this point -- if the election were held today, as measured by the generic presidential ballot. However, that result does not necessarily mean he is likely to be denied a second term in November 2012. At this point in 1991, George H.W. Bush looked like a sure bet to win a second term, but he was defeated.
One key factor in determining Obama's eventual electoral fate is whom the Republican Party nominates as its presidential candidate and the appeal that person has compared with Obama. Mitt Romney , but Americans have generally not held the last few years.
The state of the nation will also influence whether Obama is elected to a second term. Right now, Americans in this country, .
However, the political environment can certainly change in the 16 months leading up to the election, something that occurred during the 1984 and 1996 election cycles (in the incumbent's favor) and 1992 cycle (in the opponent's favor) when incumbent presidents were seeking re-election.
Survey Methods
Results for this ÆéûÜǨû§poll are based on telephone interviews conducted July 7-10, 2011, with a random sample of 897 registered voters, aged 18 and older, living in all 50 U.S. states and the District of Columbia.
For results based on the total sample of registered voters, one can say with 95% confidence that the maximum margin of sampling error is ±4 percentage points.
Interviews are conducted with respondents on landline telephones and cellular phones, with interviews conducted in Spanish for respondents who are primarily Spanish-speaking. Each sample includes a minimum quota of 400 cell phone respondents and 600 landline respondents per 1,000 national adults, with additional minimum quotas among landline respondents for gender within region. Landline telephone numbers are chosen at random among listed telephone numbers. Cell phone numbers are selected using random-digit-dial methods. Landline respondents are chosen at random within each household on the basis of which member had the most recent birthday.
Samples are weighted by gender, age, race, Hispanic ethnicity, education, region, adults in the household, and phone status (cell phone only/landline only/both, cell phone mostly, and having an unlisted landline number). Demographic weighting targets are based on the March 2010 Current Population Survey figures for the aged 18 and older non-institutionalized population living in U.S. telephone households. All reported margins of sampling error include the computed design effects for weighting and sample design.
In addition to sampling error, question wording and practical difficulties in conducting surveys can introduce error or bias into the findings of public opinion polls.
View methodology, full question results, and trend data.
For more details on Gallup's polling methodology, visit .
