PRINCETON, NJ -- More than 9 in 10 Americans still say "yes" when asked the basic question "Do you believe in God?"; this is down only slightly from the 1940s, when ÆéûÜǨû§first asked this question.
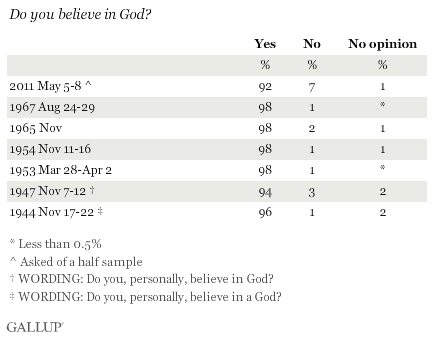
Despite the many changes that have rippled through American society over the last 6 ô§ decades, belief in God as measured in this direct way has remained high and relatively stable. ÆéûÜǨû§initially used this question wording in November 1944, when 96% said "yes." That percentage dropped to 94% in 1947, but increased to 98% in several ÆéûÜǨû§surveys conducted in the 1950s and 1960s. ÆéûÜǨû§stopped using this question format in the 1960s, before including it again in Gallup's May 5-8 survey this year.
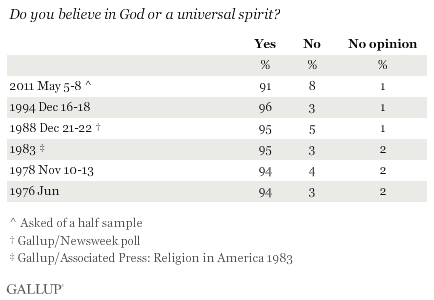
In 1976, ÆéûÜǨû§began using a slightly different question format to measure belief in a deity -- "Do you believe in God or a universal spirit?" -- and found that 94% of Americans agreed. That percentage stayed fairly steady through 1994, and is at 91% in the May 2011 survey.
Young Americans, Liberals, Easterners Least Likely to Believe in God
Responses to the two slightly different question formats from Gallup's May 5-8 survey can be combined to provide a larger sample for subgroup analysis. The results show that belief in God appears to be generally high across most subgroups of the American population.
Belief in God drops below 90% among younger Americans, liberals, those living in the East, those with postgraduate educations, and political independents. However, belief in God is nearly universal among Republicans and conservatives and, to a slightly lesser degree, in the South.
Belief in God Lower When Other Alternatives Offered
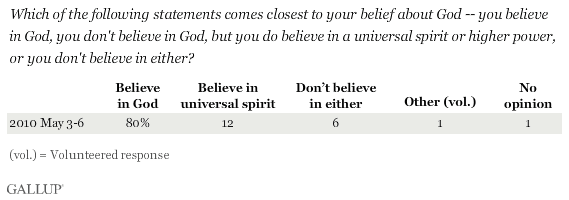
ÆéûÜǨû§has asked about belief in God using different question wordings in past surveys, all of which give respondents expanded response alternatives. One such question includes the explicit choice of belief in a universal spirit or higher power, while another allows respondents to express doubts about belief in God. Using these questions, the percentages of Americans who say they believe in God without doubts or as separate from a universal spirit have ranged from 73% to 86%.
The percentages who more definitively say there is no God are generally 6% or 7% across these questions, similar to the 7% or 8% who do not believe in God in the questions asked this year. This suggests that most Americans do believe in God, but when given the opportunity to express some uncertainty, a modest percentage opt to do so.
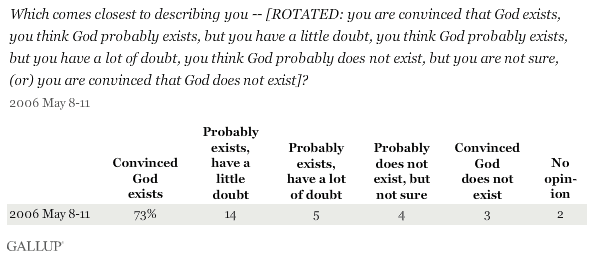
None of these expanded question formats was used by ÆéûÜǨû§before the late 1990s, leaving open the question of how Americans would have responded to these wordings in the 1940s or 1950s.
Implications
Americans' self-reported belief in God has been relatively constant over the last 6 ô§ decades. The percentage of Americans who say "yes" when asked if they believe in God is just a few percentage points lower today than it was in the 1940s, and within six points of the all-time high in the 1950s and 1960s.
However, past ÆéûÜǨû§surveys have shown that not all Americans are absolutely certain in their beliefs about God. Given the ability to express doubts about their beliefs, the percentage who stick to a certain belief in God drops into the 70% to 80% range. Additionally, when Americans are given the option of saying they believe in a universal spirit or higher power instead of in "God," about 12% choose the former. Still, the May 2011 poll reveals that when given only the choice between believing and not believing in God, more than 9 in 10 Americans say they do believe.
Other indicators of religiosity in America have shown more dramatic changes in recent decades, most significantly Americans' self-identification with a religion. At some points in the 1950s, almost all Americans identified themselves with a particular religion. In recent years, more than 1 in 10 Americans .
Those under 30 are significantly less likely than older Americans to say they believe in God. It remains to be seen whether these young Americans will move toward a belief in God as they age, or instead stick with their current beliefs. Regionally, the data confirm the religious potency of the "Bible Belt," with Southerners 10 points more likely than Easterners to say they believe in God.
Survey Methods
Results for this ÆéûÜǨû§poll are based on telephone interviews conducted May 5-8, 2011, with a random sample of 1,018 adults, aged 18 and older, living in all 50 U.S. states and the District of Columbia.
For results based on the total sample of national adults, one can say with 95% confidence that the maximum margin of sampling error is ôÝ4 percentage points.
Interviews are conducted with respondents on landline telephones and cellular phones, with interviews conducted in Spanish for respondents who are primarily Spanish-speaking. Each sample includes a minimum quota of 400 cell phone respondents and 600 landline respondents per 1,000 national adults, with additional minimum quotas among landline respondents for gender within region. Landline telephone numbers are chosen at random among listed telephone numbers. Cell phone numbers are selected using random-digit-dial methods. Landline respondents are chosen at random within each household on the basis of which member had the most recent birthday.
Samples are weighted by gender, age, race, Hispanic ethnicity, education, region, adults in the household, and phone status (cell phone only/landline only/both, cell phone mostly, and having an unlisted landline number). Demographic weighting targets are based on the March 2010 Current Population Survey figures for the aged 18 and older non-institutionalized population living in U.S. telephone households. All reported margins of sampling error include the computed design effects for weighting and sample design.
In addition to sampling error, question wording and practical difficulties in conducting surveys can introduce error or bias into the findings of public opinion polls.
View methodology, full question results, and trend data.
For more details on Gallup's polling methodology, visit .
