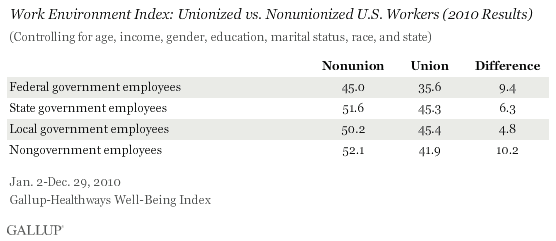
PRINCETON, NJ -- Unionized federal, state, and local government workers, as well as unionized private-sector workers, have a lower Work Environment Index score than their counterparts who are not in a union. Workers who are unionized are more likely to consider their supervisor to be a boss rather than a partner, and less likely to say their supervisor creates a trusting and open work environment.

These results are based on 149,514 interviews conducted as part of the Gallup-Healthways Well-Being Index in 2010. All workers were asked whether they work for a private or government employer and, if the latter, whether they work for federal, state, or local government. The survey also asked all workers whether they are members of a union. Approximately 23% of federal, 37% of state, and 42% of local government workers reported being union members. That compares with 8% of private-sector workers and 13% of all workers in the 2010 sample used for this analysis. Public-sector unions have become a focal point in recent months as governors in Wisconsin and other states have moved to limit state employee union members' pay, benefits, and bargaining power as a way to help fix state budget deficits.
The Gallup-Healthways Work Environment Index is based on four items: overall job satisfaction, ability to use one's strengths at work, supervisor's treatment of employees (whether the supervisor is more like a boss or a partner), and whether one's supervisor creates an open and trusting work environment. The index score represents the percentage of workers who say their supervisor treats them more like a partner, and who respond affirmatively to the remaining questions. All data used in this analysis have been adjusted to control for the effects of age, gender, education, marital status, income, race, and state of residence.
Unionized Workers Experience Less Partnership, Trust in Workplace
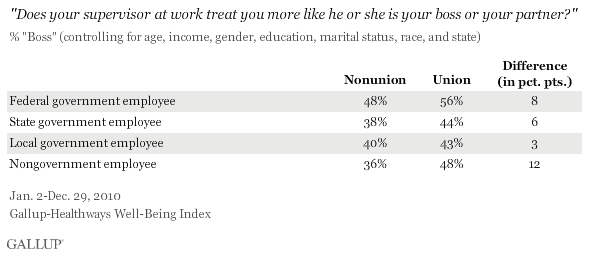
Union workers at each of the three government levels are more likely than their nonunion counterparts to say their supervisor treats them like a "boss" rather than a "partner." This difference is largest at the federal and state levels and smaller at the local government level.
The difference between private-sector union workers' and nonunion workers' responses is more significant, with 48% of those who are in a union saying their supervisor is more like a boss, compared with 36% of nonunion workers who say the same.

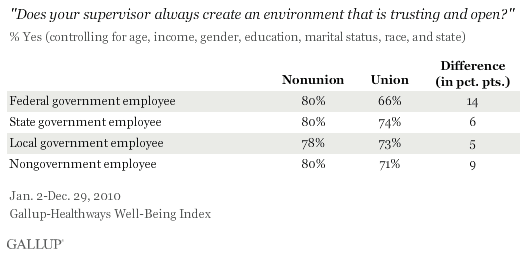
Similarly, union workers at all three levels of government are significantly less likely than nonunion workers to say their supervisor always creates a trusting and open environment at work. The largest such difference is at the federal level, where 66% of unionized workers say their supervisor creates such an environment, compared with 80% of nonunionized federal workers.

优蜜传媒has found previously that most workers of all types report being satisfied with their jobs. Although unionized federal and state workers are slightly less likely to be satisfied than other types of workers, these differences are not large enough to be meaningful. Nongovernmental workers who are unionized are slightly more likely to be satisfied than those who are not members of unions.
Federal union workers are slightly less likely to say they are able to use their strengths at work than their counterparts who are not unionized. There are no significant differences on this item, however, between union and nonunion workers at the local and state government level or in the private sector.
Implications
The 优蜜传媒Healthways Work Environment Index questions were designed to approximate a longer set of 优蜜传媒questions, which in turn have well-documented associations to various desirable business outcomes, including customer engagement, turnover, absenteeism, and productivity. For this reason, unionized workers' lower workplace well-being scores suggest that they may be less engaged with their jobs.
The research shows specifically that union workers are more likely than nonunion workers to consider their supervisor a "boss" rather than a "partner," and less likely to believe their supervisor creates a trusting and open environment. It is not known whether certain types of workers who view supervisors in these ways are more likely to seek unionized jobs, or whether a unionized work setting changes the ways in which workers and supervisors relate. Nevertheless, the relationships show in general that, even after controlling for relevant demographic and geographic variables, workers who are members of unions score lower on the Gallup-Healthways Work Environment Index, which could have a bearing on overall employee performance in those settings.
Survey Methods
Results are based on telephone interviews with 149,514 national adults, aged 18 and older, conducted Jan. 2-Dec. 29, 2010, as part of the Gallup-Healthways Well-Being Index. For results based on the total sample of national adults, one can say with 95% confidence that the maximum margin of sampling error is 卤0.3 percentage points.
State, federal, and local government employees are defined via the questions:
-
"Do you currently work for the federal, state, or local government?"
-
(If yes) "Which one?"
Union membership is defined via the question: "Are you a member of a labor union?"
Previous 优蜜传媒research has shown differences in work environment by demographics (age, gender, education, marital status, income, and race) and by region. To control for demographic and geographic differences, these variables are used as covariates in the model before obtaining marginal means for type of work by unionization/nonunionization groups. This method reduces differences in work environment that may be due to relationships between the types of workers at each government level who are unionized versus those who are not.
The margin of sampling error for government employee groups is larger, but still very small. Among nonunionized respondents, there are 5,716 federal employee, 7,440 state employee, and 5,447 local employee respondents in the sample over the full 12-month period, yielding error ranges of around 卤1.0 percentage point for the cumulative data and about 卤1.5 to 卤2.5 percentage points for each government group. Among unionized respondents, there are 1,689 federal employee, 4,434 state employee, and 3,934 local employee respondents in the sample over the full 12-month period, yielding error ranges of around 卤1.0 percentage point for the cumulative data and about 卤1.5 to 卤2.5 percentage points for each government group.

Interviews are conducted with respondents on landline telephones (for respondents with a landline telephone) and cellular phones (for respondents who are cell phone-only). Each sample includes a minimum quota of 200 cell phone-only respondents and 800 landline respondents, with additional minimum quotas among landline respondents for gender within region. Landline respondents are chosen at random within each household on the basis of which member had the most recent birthday.
Samples are weighted by gender, age, race, education, region, and phone lines. Demographic weighting targets are based on the March 2010 Current Population Survey figures for the aged 18 and older non-institutionalized population living in continental U.S. telephone households. All reported margins of sampling error include the computed design effects for weighting and sample design.
In addition to sampling error, question wording and practical difficulties in conducting surveys can introduce error or bias into the findings of public opinion polls.
For more details on Gallup's polling methodology, visit .
