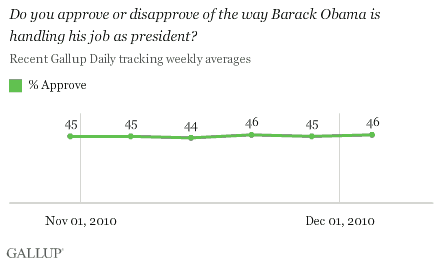
PRINCETON, N.J. -- President Barack Obama's job approval rating has held steady in the mid-40% range since the midterm elections last month. His average rating for the week leading up to the midterms was 45%, and it has remained close to that, including a 46% rating for the week of Nov. 29-Dec. 5.

The stability in Obama's rating since the midterm elections is notable. Most presidents whose parties suffered heavy losses in the midterms saw their average approval ratings fall after the midterm elections through the end of the year, including George W. Bush (down three percentage points in 2006), Bill Clinton (down four points in 1994), and Gerald Ford (down eight points in 1974). Ronald Reagan's approval ratings were unchanged after the 1982 midterm elections.
The largest post-midterm drop for a president's approval rating since 1974 was Reagan's 15-point decline in 1986, but that was in response to the Iran-Contra scandal rather than the outcome of that year's midterm elections.

Obama's Ratings Continue to Show Large Party, Race Divisions
Obama's job approval by political party has been stable in recent weeks and continues to show large gaps among party groups. Democrats are naturally the most supportive, with about 8 in 10 currently approving of the job Obama is doing as president. Obama's approval rating among independents is roughly half that of Democrats, with 42% expressing approval of the president during the week of Nov. 29-Dec. 5. Obama finds little support among Republicans, with about 1 in 10 evaluating him positively.

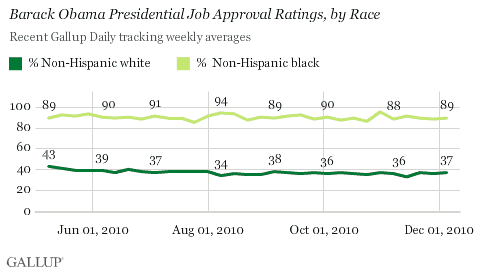
Racial groups also continue to give significantly different assessments of Obama's job performance. Currently, 89% of blacks approve, compared with 37% of non-Hispanic whites. While no more than 40% of whites have approved of Obama since May, approval among blacks has yet to drop below 85% in any week of his presidency.

Implications
Voters took out their frustrations on Obama and the Democratic congressional majority for the state of the nation and their policies in the midterm elections. Since then, Americans' opinions of Obama have changed little, in contrast to most other recent presidents who saw their party lose significant numbers of seats in Congress at the midterm.
Still, Americans and . To the extent these attitudes remain negative, Obama may see his support erode.
The political challenge for Obama is to win back enough public support for re-election in 2012. All incumbent presidents since Harry Truman who . Ford's 45% approval rating prior to the 1976 election is the most similar to Obama's current 46% approval rating, and Ford was defeated for re-election. To date, George W. Bush in 2004 had the , 48%.
Results are based on telephone interviews conducted as part of 优蜜传媒Daily tracking for the week of November 29-December 5, 2010, with a random sample of 3,071 adults, aged 18 and older, living in all 50 U.S. states and the District of Columbia, selected using random-digit-dial sampling.
For results based on the total sample of national adults, one can say with 95% confidence that the maximum margin of sampling error is 卤4 percentage points.
Interviews are conducted with respondents on landline telephones and cellular phones, with interviews conducted in Spanish for respondents who are primarily Spanish-speaking. Each daily sample includes a minimum quota of 150 cell phone respondents and 850 landline respondents, with additional minimum quotas among landline respondents for gender within region. Landline respondents are chosen at random within each household on the basis of which member had the most recent birthday.
Samples are weighted by gender, age, race, Hispanic ethnicity, education, region, adults in the household, cell phone-only status, cell phone-mostly status, and phone lines. Demographic weighting targets are based on the March 2009 Current Population Survey figures for the aged 18 and older non-institutionalized population living in U.S. telephone households. All reported margins of sampling error include the computed design effects for weighting and sample design.
In addition to sampling error, question wording and practical difficulties in conducting surveys can introduce error or bias into the findings of public opinion polls.
For more details on Gallup's polling methodology, visit .
