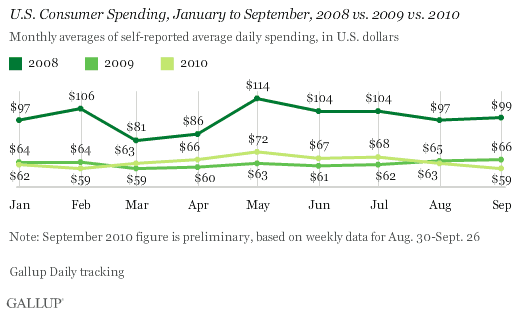
PRINCETON, NJ -- Americans' self-reported spending in stores, restaurants, gas stations, and online averaged $59 per day during the first four weeks of September. Consumer spending is down from August ($63) and July ($68), and now matches its lowest level of 2010. Current spending is lower than that of a year ago and far below spending in September 2008, at the start of the financial collapse.

Weekly Self-Reported Spending Falls in Past Two Weeks
averaged $56 per day in the two weeks ending Sept. 26. This is down from $64 and $61 during the prior two weeks of September. The most recent two weeks are not only among the lowest spending weeks of 2010 but also below spending levels of the same weeks in 2009.

Hitting an Economic Wall Again
Former Federal Reserve Chairman Alan Greenspan noted earlier this year that the U.S. economy seemed to hit a wall in June. Since that point, ���۴�ýand other economic data have shown the economy slowing, and economists have lowered their forecasts for the second half of 2010.
Over the past couple of weeks in particular, Gallup's consumer spending measure shows another dropoff -- returning to the February lows for the year, and falling below year-ago "new normal" levels. At the same time, Gallup's underemployment measure shows more people losing their jobs in recent weeks -- with unemployment hitting 10% for the 30 days ending Sept. 27 and Sept. 28. is also running at its low point for 2010.
It may be that today's unusually high economic uncertainty has put Americans in a wait-and-see mode. Consumers and small business owners may simply be pulling back until the economic landscape is clearer.
On the other hand, this may just be a couple of weeks' economic pause that Gallup's everyday measurement of the economic data has revealed. Perhaps people are spending less after the back-to-school season or in anticipation of the coming holidays. It is possible that Gallup's economic measures will see a course reversal and turn more positive just in time for the Christmas holidays.
However, if the spending and jobs trends of the past two weeks continue, it could result in even less growth than economists' revised projections suggest, and require further downward revisions, making for an extremely interesting Federal Reserve meeting in early November.
Gallup.com reports results from these indexes in daily, weekly, and monthly averages and in Gallup.com stories. Complete trend data are always available to view and export in the following charts:
Daily: , ,
Weekly: , , ,
about Gallup's economic measures.
Results are based on telephone interviews conducted as part of ���۴�ýDaily tracking with a random sample of 1,000 adults, aged 18 and older, living in all 50 U.S. states and the District of Columbia, selected using random-digit-dial sampling.
For results based on the weekly sample of national adults averaging 3,500 interviews, one can say with 95% confidence that the maximum margin of sampling error is ±2 percentage points.
Interviews are conducted with respondents on landline telephones and cellular phones, with interviews conducted in Spanish for respondents who are primarily Spanish-speaking. Each daily sample includes a minimum quota of 150 cell phone respondents and 850 landline respondents, with additional minimum quotas among landline respondents for gender within region. Landline respondents are chosen at random within each household on the basis of which member had the most recent birthday.
Samples are weighted by gender, age, race, Hispanic ethnicity, education, region, adults in the household, cell phone-only status, cell phone-mostly status, and phone lines. Demographic weighting targets are based on the March 2009 Current Population Survey figures for the aged 18 and older non-institutionalized population living in U.S. telephone households. All reported margins of sampling error include the computed design effects for weighting and sample design.
In addition to sampling error, question wording and practical difficulties in conducting surveys can introduce error or bias into the findings of public opinion polls.
For more details on Gallup's polling methodology, visit .
