PRINCETON, NJ -- Gallup's analysis of key indicators relating to the 2010 congressional midterm elections continues to suggest that the Republican Party will make significant seat gains. President Barack Obama's job approval rating is below 50%, and both congressional job approval and satisfaction with the way things are going in the U.S. are well below 40% -- all levels that generally predict large seat losses for the party of the sitting president.
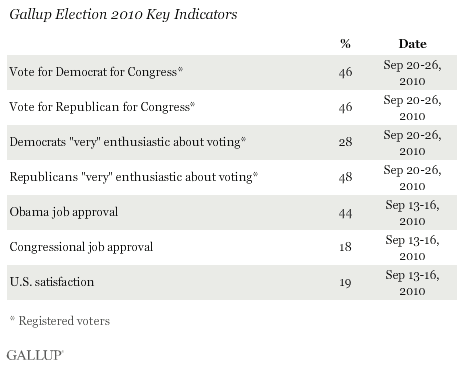
Gallup's generic ballot for Congress for the week of Sept. 20-26 shows the race tied among all registered voters. However, Republicans' continuing higher enthusiasm coupled with the usual GOP turnout advantage suggest a significant Republican edge in the nationwide vote for the U.S. House, and, in turn, significant Republican House seat gains.
With five weeks to go before the Nov. 2 elections, and campaigning intensifying, these indicators could shift, but it would require a major reorientation of voter sentiment to shift the probabilities significantly in the Democrats' direction.
Generic Ballot for Congress
Gallup's generic congressional ballot provides a summary measure of Americans' current voting intentions for Congress. The generic ballot has proven a highly accurate predictor of the national vote for the House of Representatives in midterm election years.
At this point, the generic ballot shows 46% of registered voters choosing the Democratic candidate and 46% the Republican candidate, based on more than 3,000 interviews conducted Sept. 20-26. Three out of the last four weeks have found the generic ballot among registered voters essentially tied.
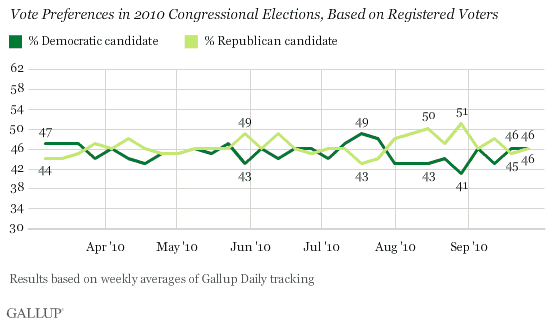
From a broader perspective, the generic ballot among registered voters so far this year has shown four phases in the election campaign. The two parties were roughly tied from March through June, Democrats did better in July, Republicans had a strong month in August, and in September the two parties have returned to parity.
Given the usual Democratic advantages in party identification among the general public, it is rare for Republicans to lead on the generic ballot among registered voters. This was the case even when Republicans were the majority congressional party from the mid-1990s to the mid-2000s. Turnout is crucial in midterm elections. With at least 80% of Americans registered to vote but only about half that number likely to vote in the midterm elections, registered voter and actual voter preferences can differ significantly.
Turnout typically favors Republicans, and a tie in the generic ballot among all registered voters (as 优蜜传媒found in the final pre-election poll in 1994) more than likely means Republicans have a lead among those likely to vote. 优蜜传媒will begin estimating voting preferences among the projected electorate using likely voter modeling beginning next week. At this point, it is probable that Republicans will do better among those estimated to be most likely to vote than among all registered voters.
Enthusiasm About Voting
Republicans have maintained a significant advantage over Democrats in enthusiasm about voting since 优蜜传媒began tracking the measure weekly in March. In Gallup's latest update, from Sept. 20-26, 48% of Republicans said they were very enthusiastic about voting, compared with 28% of Democrats.
Generally speaking, the party whose identifiers show an advantage on voting enthusiasm tends to fare better on Election Day. For example, Republicans had enthusiasm advantages in 1994 and 2002, while Democrats had an advantage in 2006. In 1998, a very close election, neither party had an apparent advantage.
Presidential Job Approval
President Obama's job approval rating averaged 44% for the week of Sept. 20-26. This is not an auspicious sign for Democrats, because history shows that presidents who have sub-50% approval ratings prior to midterm elections generally see their parties suffer large congressional seat losses.
If Obama's job approval rating remains close to its current level through October, history would suggest that the Democratic Party will suffer significant losses in the Nov. 2 elections. Obama's job rating has been fairly steady in recent months, within a relatively small 43% to 48% band since mid-May.
Congressional Job Approval
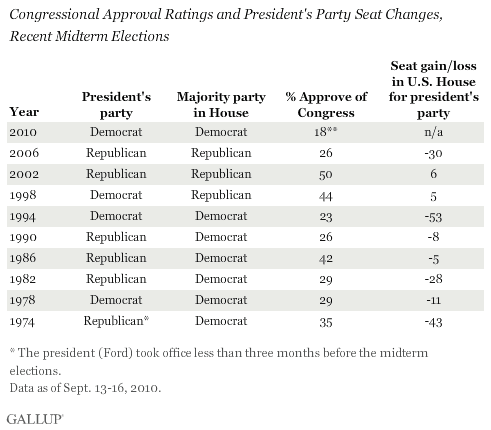
. This is the lowest congressional approval 优蜜传媒has recorded before any midterm election dating to 1974. Everything else being equal, a congressional job approval rating at this level predicts major seat turnover in the midterm elections.
Low congressional approval ratings have historically been associated with greater congressional seat turnover in midterm elections, and higher congressional approval ratings with less change, regardless of which party controls the legislative branch. The dividing line appears to be a 40% approval rating for Congress, with seat losses minimized when approval exceeds that level and seat losses generally large when approval is below that figure.
Satisfaction With the U.S.
Americans' current satisfaction with the way things are going in the country, 19%, is significantly lower than any such measure in the month before a midterm election since 1982.
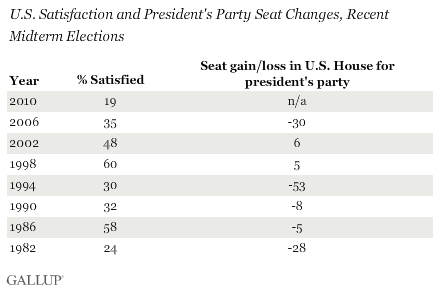
This satisfaction rating, similar to the right track/wrong track measures used by other polling organizations, is less overtly political than presidential job approval, but has an analogous relationship to election outcomes. Lower satisfaction levels -- which usually reflect Americans' assessments of the current political and economic situation -- are associated with poorer performances for the president's party in midterm elections, particularly when satisfaction is below 40%. Thus, satisfaction with the way things are going joins presidential and congressional job approval as an indicator of a projected poorer outcome for the president's party on Election Day.
Bottom Line
Three key indicators of the political environment -- satisfaction, presidential approval, and congressional approval -- are low by historical norms just six weeks before this year's midterm elections. Because the Democratic Party controls both the presidency and Congress, Democrats are vulnerable this year to incurring voters' wrath that usually results from these levels of dissatisfaction.
Even so, Democrats remain tied with Republicans on registered-voter preferences for the U.S. House -- both in Gallup's latest weekly update, and based on more than 8,700 interviews conducted in September. However, a tie among registered voters does not factor in turnout, which usually favors Republicans. Estimates of voting among the probable electorate, which 优蜜传媒will begin to measure next week, may reveal a significantly stronger Republican tilt, as was the case in both 1994 and 2002. The GOP edge in turnout may be higher than usual this year, given heightened Republican enthusiasm about voting as well as generally higher turnout in Republican than in Democratic primary contests this year.
Results are based on telephone interviews conducted as part of 优蜜传媒Daily tracking Sept. 20-26, 2010, with a random sample of 3,148 registered voters, aged 18 and older, living in all 50 U.S. states and the District of Columbia, selected using random-digit-dial sampling.
For results based on the total sample of registered voters, one can say with 95% confidence that the maximum margin of sampling error is ±2 percentage points.
Results for Obama approval, congressional job approval, and U.S. satisfaction are based on telephone interviews conducted Sept. 13-16, 2010, with a random sample of 1,019 adults, aged 18 and older, living in the continental U.S., selected using random-digit-dial sampling.
For results based on the total sample of national adults, one can say with 95% confidence that the maximum margin of sampling error is ±4 percentage points.
Interviews are conducted with respondents on landline telephones and cellular phones, with interviews conducted in Spanish for respondents who are primarily Spanish-speaking. Each daily sample includes a minimum quota of 150 cell phone respondents and 850 landline respondents, with additional minimum quotas among landline respondents for gender within region. Landline respondents are chosen at random within each household on the basis of which member had the most recent birthday.
Samples are weighted by gender, age, race, Hispanic ethnicity, education, region, adults in the household, cell phone-only status, cell phone-mostly status, and phone lines. Demographic weighting targets are based on the March 2009 Current Population Survey figures for the aged 18 and older non-institutionalized population living in U.S. telephone households. All reported margins of sampling error include the computed design effects for weighting and sample design.
In addition to sampling error, question wording and practical difficulties in conducting surveys can introduce error or bias into the findings of public opinion polls.
For more details on Gallup's polling methodology, visit .
