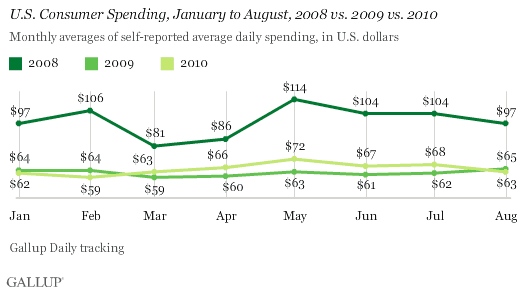
PRINCETON, NJ -- Americans' self-reported average daily spending in stores, restaurants, gas stations, and online averaged $63 per day during August -- down $5 from July, and down $2 compared with August 2009. Consumer discretionary year-over-year spending is thus running just slightly below the depressed "new normal" rate of a year ago.

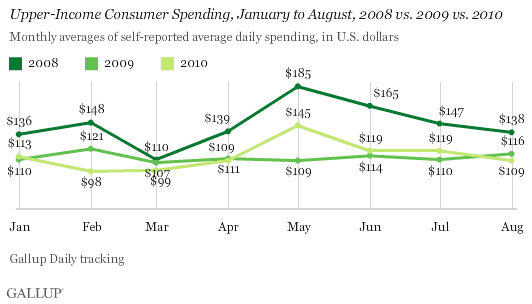
Upper-Income Spending Remains Far Below May 2010 Levels
Upper-income Americans (those making $90,000 or more annually) reported spending an average of $109 per day in August, down $10 from June and July, and down $36 from May. Spending among this group is also down $7 compared with August 2009. Only once -- in May -- has 2010 upper-income spending exceeded the 2009 "new normal" spending range of $107 to $121 per day.

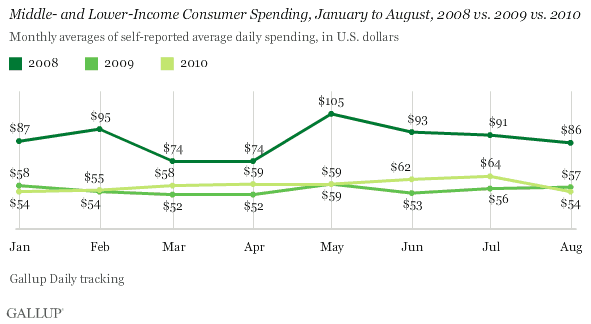
Month-Over-Month Middle- and Lower-Income Spending Falls
Middle- and lower-income Americans spent an average of $54 per day during August -- down from $64 in July and $62 in June, and lower than the $57 seen in August 2009. Americans in these income groups had been spending at the higher end of last year's "new normal" range of $52 to $61 but are now back to the lower end of that range.

Spending Trends Going in the Wrong Direction
A year ago at this time, the U.S. economy was showing signs of having bottomed out. Americans' discretionary spending had stabilized and began to show signs of modest improvement. While tepid back-to-school spending in August 2009 signaled moderate Christmas spending, people seemed to be getting , and upper-income spending showed signs of life in .
This year, consumers -- particularly upper-income Americans -- . However, the spending spurt was short-lived, with August spending returning to 2009 levels among both upper-income and middle-/lower-income consumers. In a sense, the current direction of consumer spending seems to be just the reverse of spending during this time a year ago.
This year's somewhat disappointing back-to-school spending has been followed by few added expenditures for Labor Day. Consumer spending for the week before Labor Day averaged $61 per day -- the same as during the prior week, and down from a $70 average during the same week in 2009.
Spending prospects for the next couple of months do not look much better, with Americans peppered by economic pessimism as the midterm elections approach. Many Republicans are talking about a lack of economic improvement. And the president is promoting new efforts to get the weak economy going. Neither party seems to hold out much hope for a significantly better jobs outlook or a surge in economic growth anytime soon.
On the other hand, no matter what happens in the elections, Americans could go on a post-election holiday spending spree. It just may be that a newly elected Congress could create some sorely missing economic optimism about the outlook for 2011.
Gallup.com reports results from these indexes in daily, weekly, and monthly averages and in Gallup.com stories. Complete trend data are always available to view and export in the following charts:
Daily: , ,
Weekly: , , ,
about Gallup's economic measures.
Results are based on telephone interviews conducted as part of ���۴�ýDaily tracking August 1-31, 2010, with a random sample of 15,375 adults, aged 18 and older, living in all 50 U.S. states and the District of Columbia, selected using random-digit-dial sampling.
For results based on the total sample of national adults, one can say with 95% confidence that the maximum margin of sampling error is ±4 percentage points.
Interviews are conducted with respondents on landline telephones and cellular phones, with interviews conducted in Spanish for respondents who are primarily Spanish-speaking. Each daily sample includes a minimum quota of 150 cell phone respondents and 850 landline respondents, with additional minimum quotas among landline respondents for gender within region. Landline respondents are chosen at random within each household on the basis of which member had the most recent birthday.
Samples are weighted by gender, age, race, Hispanic ethnicity, education, region, adults in the household, cell phone-only status, cell phone-mostly status, and phone lines. Demographic weighting targets are based on the March 2009 Current Population Survey figures for the aged 18 and older non-institutionalized population living in U.S. telephone households. All reported margins of sampling error include the computed design effects for weighting and sample design.
In addition to sampling error, question wording and practical difficulties in conducting surveys can introduce error or bias into the findings of public opinion polls.
For more details on Gallup's polling methodology, visit .
