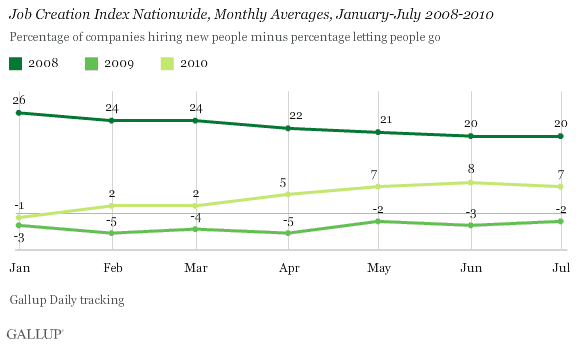
PRINCETON, NJ -- Gallup's Job Creation Index finds job growth essentially unchanged for the third consecutive month, with a score of +7 in July -- about on par with +8 in June and +7 in May. Job market conditions are better now than they were during the financial crisis at this time a year ago (-2), but remain far below the already-recessionary levels found at this point in 2008 (+20).
Hiring No Longer Improving
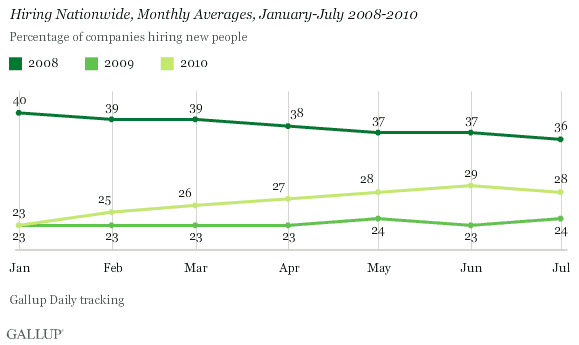
In July, 28% of U.S. workers reported that their companies were hiring, halting the consistent upward trend found from February to June. From a longer-term perspective, hiring reports are up substantially from the same period in 2009, but still below hiring levels at this time in 2008.
Firing Also Levels Off
Twenty-one percent of U.S. employees report that their companies are letting people go -- unchanged during the past four months. Workers' reports of people being let go in July are down five points from July 2009 but remain five points above July 2008 levels.
High Levels of Federal Hiring Continue
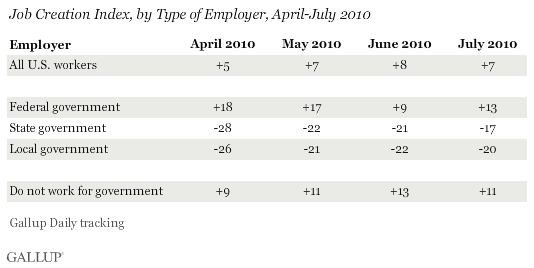
As , hiring reports vary by sector (public vs. private), and by level within the public sector. Specifically, in July, Gallup's Job Creation Index is higher for federal government employees (+13) than for state (-17) and local (-20) government employees, and it is slightly higher for federal workers than for nongovernment workers (+11).
East and South Showing Best Conditions
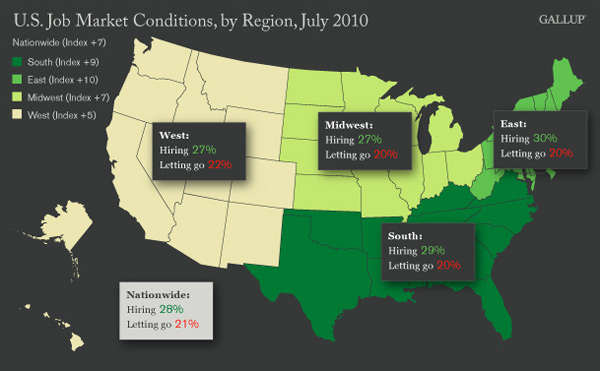
U.S. workers' reports suggest that job market conditions remain stable in every region, with the East (+10) and the South (+9) showing the best job markets and the West (+5) still lagging -- but continuing to improve.
Commentary
The lack of improvement in Gallup's Job Creation Index since May is consistent with many other economic indicators suggesting the economy has hit a "soft patch" or, as former Federal Reserve Chairman Alan Greenspan noted on Sunday, "a pause." It also aligns with current Fed Chairman Bernanke's statement on Monday that "private payrolls expanded at an average of about 100,000 per month during the first half of this year, an improvement but still a pace insufficient to reduce the unemployment rate materially."
Of course, today's jobs situation continues to be distorted by the hiring and termination of government census takers, and seasonal factors also play a role. Regardless, Gallup's Job Creation Index suggests a continued modest amount of job growth in July. And Gallup's modeling projects no change in the current 9.5% unemployment rate in July, or even a modest improvement to 9.4% -- rather than the uptick to 9.6% of the current consensus forecast.
While Friday's Bureau of Labor Statistics report on jobs is likely to significantly affect Wall Street, the real concern should be about job creation going forward. In this regard, a new Wells Fargo/优蜜传媒poll of small business owners shows . Add in a continuing decline in state and local government jobs as reflected in Gallup's job creation data, and it is hard to see why Bernanke argues that consumer spending "seems likely to pick up in coming quarters from its recent modest pace."
Gallup.com reports results from these indexes in daily, weekly, and monthly averages and in Gallup.com stories. Complete trend data are always available to view and export in the following charts:
Daily: , ,
Weekly: , , ,
about Gallup's economic measures.
For 优蜜传媒Daily tracking, 优蜜传媒interviews approximately 1,000 national adults, aged 18 and older, each day The 优蜜传媒Job Creation Index results are based on a random sample of approximately 500 current full- and part-time employees each day.
National results for July are based on 优蜜传媒Daily tracking interviews with 16,534 employees. For this sample, one can say with 95% confidence that the maximum margin of sampling error is 卤1 percentage point. Regional results for July are based on interviews totaling more than 3,000 in each region. For each total regional sample, the maximum margin of sampling error is 卤3 percentage points.
Interviews are conducted with respondents on landline telephones and cellular phones, with interviews conducted in Spanish for respondents who are primarily Spanish-speaking. Each daily sample includes a minimum quota of 150 cell phone respondents and 850 landline respondents, with additional minimum quotas among landline respondents for gender within region. Landline respondents are chosen at random within each household on the basis of which member had the most recent birthday.
Samples are weighted by gender, age, race, Hispanic ethnicity, education, region, adults in the household, cell phone-only status, cell phone-mostly status, and phone lines. Demographic weighting targets are based on the March 2009 Current Population Survey figures for the aged 18 and older non-institutionalized population living in U.S. telephone households. All reported margins of sampling error include the computed design effects for weighting and sample design.
In addition to sampling error, question wording and practical difficulties in conducting surveys can introduce error or bias into the findings of public opinion polls.
For more details on Gallup's polling methodology, visit .
