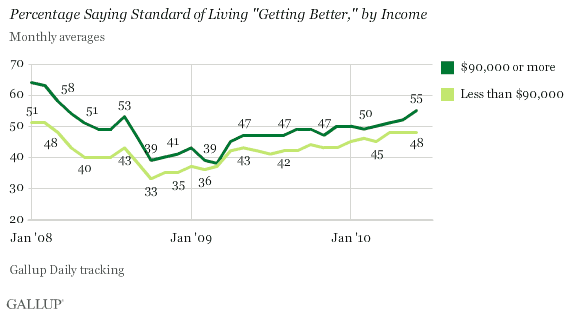
PRINCETON, NJ -- Despite the generally disappointing economic data of the past month, 55% of upper-income Americans in June said their standards of living were "getting better"-- the highest since March 2008. Similarly, 48% of lower- and middle-income Americans said their standards of living were getting better, matching the 2010 high of the past two months, and the highest since March 2008.

Over the past 15 months, upper-income Americans have become comparatively more likely than other Americans to say their standards of living are getting better, restoring this group to its customary, more optimistic position in comparison with lower- and middle-income Americans. For all income groups, optimism about living standards has rebounded from the more depressed assessments seen during late 2008 and early 2009 as the financial crisis worsened. At one point, upper-income Americans' optimism declined to the point that it matched the optimism of their lower- and middle-income counterparts.
Optimism About Living Standards Up Across Ages and Regions
More Americans, regardless of age, in June said their standards of living were "getting better" than did so in June 2008 and June 2009. Optimism about future living standards is highest among younger Americans and tends to decrease among older age groups.

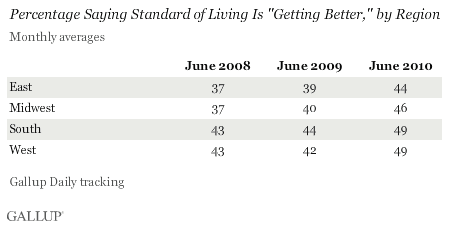
Optimism about living standards also shows an increase across regions in June compared with the past two years, but with minimal differences by region.

Standard-of-living optimism in June , compared with June 2008 and June 2009. A higher percentage of blacks than whites since the inauguration of President Obama say their standards of living are getting better.
Americans' Personal Balance Sheets Are Healing
In Gallup's new book "," the authors state, "People with thriving Financial Well-Being are satisfied with their overall standard of living. They manage their personal finances well to create financial security. This eliminates day-to-day stress caused by debt and helps build financial reserves."
While always good financial advice, these ideas are particularly appropriate for today's economic environment. Uncertainty about jobs, investments, and government policies -- on top of the recession and financial crisis of the past two years -- have consumers pulling back on their spending and reducing their use of credit. Businesses and lenders are doing likewise.
This suggests that the U.S. economic recovery may be much slower than many had hoped. A sharp drop in economic activity, such as the one the U.S. experienced during 2008-2009, is usually followed by a sharp rebound. A slow recovery is likely to prove a big disappointment to everyone on Wall Street as well as on Main Street and -- what is politically most important -- generate little or no job growth.
On the other hand, Gallup's standard-of-living measure provides insight into one of the more positive aspects of consumer deleveraging: consumer credit fell by more than $9 billion in May. As consumers build their personal balance sheets -- increasing their savings and decreasing their debt -- they increase their financial security and build their financial reserves. As they increase their standards of living, they benefit from doing so, on a firmer, more sustainable basis. And as they do so, they improve their Financial Well-Being and their potential to thrive.
Gallup.com reports results from these indexes in daily, weekly, and monthly averages and in Gallup.com stories. Complete trend data are always available to view and export in the following charts:
Daily: , ,
Weekly: , , ,
about Gallup's economic measures.
Results are based on telephone interviews conducted as part of ���۴�ýDaily tracking June 1-30, 2010, with a random sample of 30,189 adults, aged 18 and older, living in all 50 U.S. states and the District of Columbia, selected using random-digit-dial sampling.
For results based on the total sample of national adults, one can say with 95% confidence that the maximum margin of sampling error is ±1 percentage point.
For results based on the total sample of 4,994 upper-income Americans, one can say with 95% confidence that the maximum margin of sampling error is ±3 percentage points.
For results based on the total sample of 16,342 lower- and middle-income Americans, one can say with 95% confidence that the maximum margin of sampling error is ±2 percentage points.
Interviews are conducted with respondents on landline telephones and cellular phones, with interviews conducted in Spanish for respondents who are primarily Spanish-speaking. Each daily sample includes a minimum quota of 150 cell phone respondents and 850 landline respondents, with additional minimum quotas among landline respondents for gender within region. Landline respondents are chosen at random within each household on the basis of which member had the most recent birthday.
Samples are weighted by gender, age, race, Hispanic ethnicity, education, region, adults in the household, cell phone-only status, cell phone-mostly status, and phone lines. Demographic weighting targets are based on the March 2009 Current Population Survey figures for the aged 18 and older non-institutionalized population living in U.S. telephone households. All reported margins of sampling error include the computed design effects for weighting and sample design.
In addition to sampling error, question wording and practical difficulties in conducting surveys can introduce error or bias into the findings of public opinion polls.
For more details on Gallup's polling methodology, visit .
