PRINCETON, NJ -- Gallup's Economic Confidence Index worsened in late May through mid-June. Weekly averages were in the -26 to -29 range, compared with -21 to -24 in April and early May. This suggests that Friday's Reuters/University of Michigan consumer sentiment index should decline, although that is far from certain given its relatively small sample size.
Economic Outlook Deteriorating, Matching Bleak View of a Year Ago
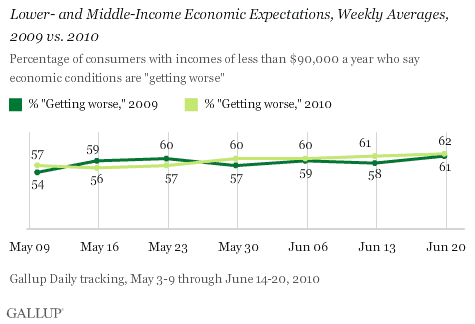
There has been a steady increase during most of the past seven weeks in the percentage of lower- and middle-income Americans saying economic conditions are "getting worse" in the U.S. as a whole, matching the recessionary levels of a year ago.
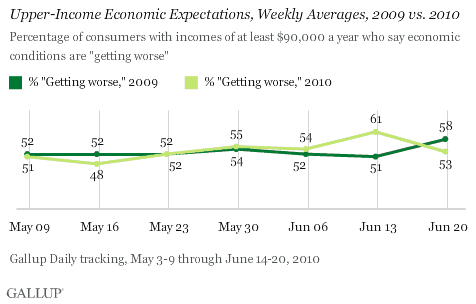
Upper-income Americans have also tended to say economic conditions are "getting worse" in larger numbers -- percentages similar to those from this time in 2009.
"Poor" Ratings of U.S. Economy Approaching Last Year
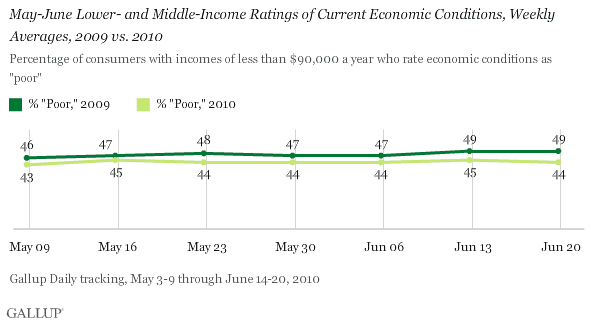
About 44% of lower- and middle-income consumers over the past seven weeks rated current economic conditions as "poor" -- slightly below 2009 levels.
More than a third of upper-income consumers also rated current economic conditions as "poor" -- generally not as high as in 2009, but not too far distant.
Bottom Line
The University of Michigan in its preliminary estimate for June reported that consumer sentiment was up from May and at its highest level since January 2008. Gallup's Daily tracking of economic confidence suggests just the reverse is the case -- confidence has been declining and early June.
Significantly, the deterioration has been more pronounced in terms of consumers' future economic expectations, with consumers of all incomes more negative about the economy's direction than they were in April and early May. Today's consumer expectations are close to those of a year ago.
Americans' worsening economic expectations make sense given recent signs of economic weakness, poor job market conditions, a weak and volatile stock market, and the continuing oil spill in the Gulf of Mexico. However, it is still somewhat disconcerting that expectations are no more hopeful than they were 12 months ago.
Monetary and fiscal authorities have taken unprecedented actions to stabilize and stimulate the U.S. economy over the past two years. The fact that Americans are not more optimistic now than they were a year ago says much about the magnitude of the financial and economic crisis, and about how long it will take the economy to recover fully.
Gallup.com reports results from these indexes in daily, weekly, and monthly averages and in Gallup.com stories. Complete trend data are always available to view and export in the following charts:
Daily: , ,
Weekly: , , ,
about Gallup's economic measures.
Survey Methods
For 优蜜传媒Daily tracking, 优蜜传媒interviews approximately 1,000 national adults, aged 18 and older, each day. The 优蜜传媒economic confidence results are based on random half-samples of approximately 500 national adults, aged 18 and older, each day. Weekly results are based on telephone interviews with approximately 3,500 adults. For these results, one can say with 95% confidence that the maximum margin of sampling error is 卤2 percentage point.
Interviews are conducted with respondents on landline telephones and cellular phones, with interviews conducted in Spanish for respondents who are primarily Spanish-speaking. Each daily sample includes a minimum quota of 150 cell phone respondents and 850 landline respondents, with additional minimum quotas among landline respondents for gender within region. Landline respondents are chosen at random within each household on the basis of which member had the most recent birthday.
Samples are weighted by gender, age, race, Hispanic ethnicity, education, region, adults in the household, cell phone-only status, cell phone-mostly status, and phone lines. Demographic weighting targets are based on the March 2009 Current Population Survey figures for the aged 18 and older non-institutionalized population living in U.S. telephone households. All reported margins of sampling error include the computed design effects for weighting and sample design.
In addition to sampling error, question wording and practical difficulties in conducting surveys can introduce error or bias into the findings of public opinion polls.
For more details on Gallup's polling methodology, visit .
