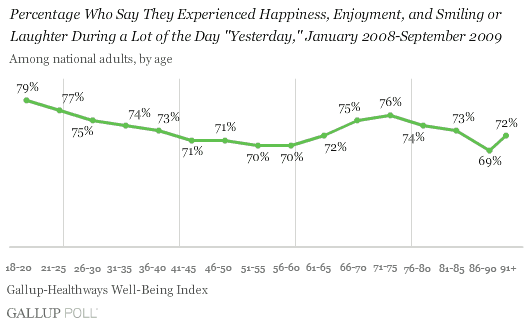
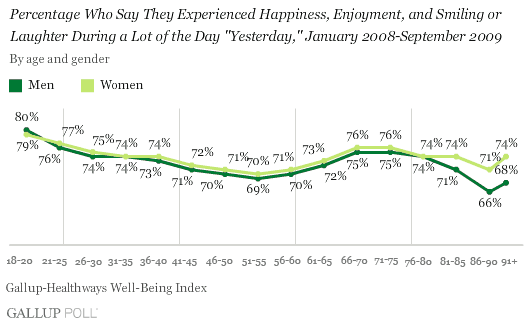
PRINCETON, NJ -- A new analysis of more than 600,000 interviews conducted in 2008 and 2009 shows that happiness is highest among Americans who are in their early adulthood. Happiness drops among Americans in their 30s and 40s, and -- in particular -- among those in their 50s; it is higher among Americans in their 60s, drops among Americans in their late 70s and 80s, and then rises again among those older than 90. Men and women in most age groups have broadly equal happiness scores, with women scoring slightly higher than men in the middle-aged years, and notably higher after age 80.

This analysis is based on a definition of happiness developed from responses to two questions about mood and one about smiling or laughing, all included in Gallup-Healthways Daily tracking. The questions are: (1) Did you experience happiness during a lot of the day yesterday? (2) Did you experience enjoyment during a lot of the day yesterday? and (3) Did you smile or laugh a lot yesterday? Survey respondents receive a positive happiness score if they respond affirmatively to all three questions. All other patterns of responses yield a score of zero.
The data reflect a cross-section of the American adult population at a particular point in time -- January 2008-September 2009 -- and thus do not allow inferences to be made about the "normal" course of life events. The happiness of the respondents included in this analysis is a combination of the life circumstances into which they were born and through which they have lived, as well as generational circumstances that affect individuals at specific ages. Thus, it is not possible with these data to determine the degree to which happiness is a result of an individual's life history and experiences, as opposed to the individual's current circumstances (including health, family situation, and economic situation).
The Age Spectrum
On an absolute basis, a majority of all Americans of all ages are happy. Happiness reaches its very lowest point -- 69% -- among Americans 86 to 90, meaning that even among this relatively less positive group, over two-thirds said they experienced happiness and enjoyment, and smiled or laughed a lot the day before they were interviewed. The happiest adult Americans are those aged 18-20, with a score of 79%.
The variations across age and gender show that at this time, Americans' happiness becomes progressively lower as one moves from groups of Americans in their 20s to those in their 30s and 40s, and -- in particular -- to American baby boomers who are now in their 50s. Thereafter, happiness is higher among the very oldest baby boomers and Silent Generation members in their 60s, but drops again among those 76 to 90. The data then show that the very oldest Americans, 91 years of age and older (of whom there are 9,654 in this sample), have a modestly more positive level of happiness in these latter years of their lives compared to youngsters only in their 80s. (Of course, this final "surge" in happiness may apply only to those of this very advanced age who enjoy enough independence to answer telephone calls and respond to the Gallup-Healthways survey).
Given the cross-sectional nature of these data, it is not possible to determine whether these same happiness-by-age patterns will persist in the years ahead. It is possible, for example, that specific life circumstances of the core baby boomer group now in their 50s will stay with them throughout their lives, and that in the years ahead, they will not enjoy the increased happiness levels now apparent among those who are in their 60s.
Gender
Averaging across all age groups, there is only a very slight difference between women's and men's scores, with women, at 73.4, about one percentage point higher on average than men, at 72.5. Given the large sample sizes involved in this analysis (more than 300,000 men and more than 300,000 women), this gender difference is statistically significant, but substantively does not suggest a major gender effect.
The pattern of gender differences varies across age groups. The female skew in happiness is statistically significant (although still quite small) among Americans 36-65, and among those over 80. The gender gap in happiness is largest among the oldest Americans, aged 86 and older.

Survey Methods
Results are based on telephone interviews with 608,221 national adults (306,167 women and 302,054 men), aged 18 and older, conducted Jan. 2, 2008-Sept. 21, 2009. For results based on the total sample of national adults, one can say with 95% confidence that the maximum margin of sampling error is less than 卤1 percentage point. Margins of error for specific age/gender subgroups range from 卤2 percentage points to less than 卤1 point, depending on the size of the group.
Interviews are conducted with respondents on land-line telephones and cellular phones.
In addition to sampling error, question wording and practical difficulties in conducting surveys can introduce error or bias into the findings of public opinion polls.
