PRINCETON, NJ -- President Barack Obama's job approval rating , and was nearly identical among employed as well as unemployed Americans. However, workers in some occupational categories gave him broader support than others.
On the high end, 71% of service workers, such as police officers, waiters and waitresses, barbers, and nurses' aides, approved in May of how Obama handled his job.
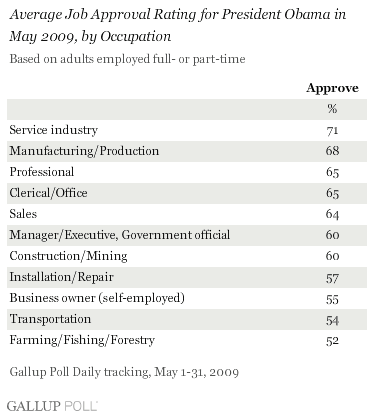
Obama received his lowest average rating -- 52% -- from workers in farming, fishing, and forestry. Obama's ratings were only a bit higher among workers employed in transportation (54%) and in installation/repair (57%), as well as among self-employed business owners (55%).
Each of the remaining major categories of workers identified in Gallup's Daily tracking gave the president a job approval rating close to his 65% overall average. This includes manufacturing employees, professionals (such as lawyers, doctors, and teachers), clerical workers, sales employees, business and government managers or officials, and those working in construction, mining, and the trades.
Business Owners Come Around
Obama's overall job approval rating was a bit higher in May than in the prior two months (62% in March and 63% in April). Since March, the sharpest increases in support for him among occupational groups have come from business owners -- a group epitomized late in the 2008 presidential campaign by "Joe the Plumber," whose question to Obama about small-business taxes heightened media attention to that issue. Business owners' approval rose from 44% in March to 51% in April and 55% in May.
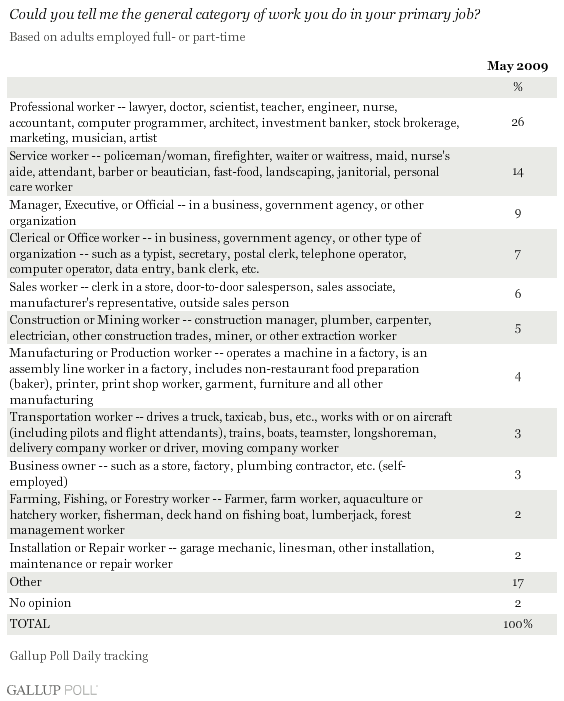
The 44% March figure for business owners is the only occupation-based, sub-50% job approval rating of Obama in the past three months. Thus, the increase to 55% is particularly notable. However, because only 3% of employed Americans identified themselves as business owners in Gallup's May polling, this change had little effect on Obama's overall job rating.
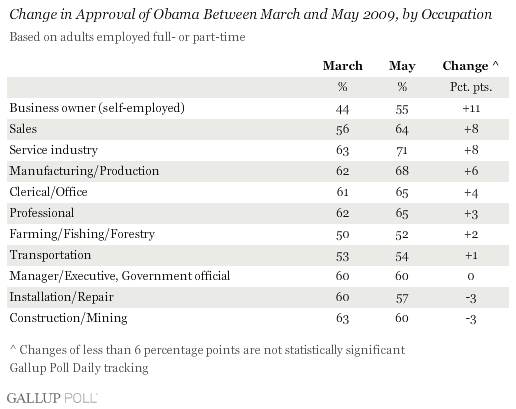
Approval of the president also rose among sales workers (from 56% in March to 64% in May), among service workers (from 63% to 71%), and among manufacturing and production workers (from 62% to 68%).
None of the remaining occupational groups show a statistically significant change in support for Obama in May compared with March.
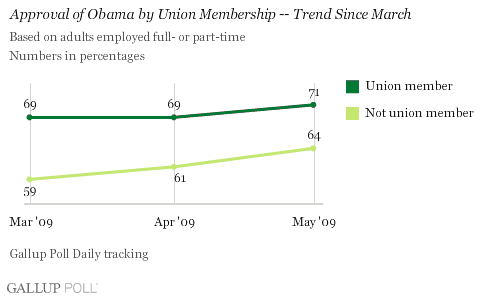
More generally, workers who are members of labor unions are a bit more likely to have approved of Obama's job performance than are nonunion employees. In May, the figures were 71% and 64%, respectively. However, the rank order of occupations according to Obama approval does not correspond directly to the rate of union membership in each occupational group. For instance, only 12% of service employees tell ÆéûÜǨû§they belong to a union, compared with 20% of installation and repair workers -- but the latter group's support for Obama is much lower.
One of the more notable distinctions in assessments of Obama by occupation is between professionals and business owners. In May, there was a 10-point difference between the two, with 65% of professionals compared with 55% of business owners approving. Nearly one in five professionals are union members, including teachers; however, even excluding these workers, 64% of nonunion professionals approved of Obama in May.
The distinction highlights the consistently strong support Obama has enjoyed from highly educated Americans since he become the Democratic Party's nominee for president last year. More generally, Americans with postgraduate educational backgrounds, as well as professional workers, tend to be more Democratic in their political orientation than the public at large: 41% of professional workers are Democratic, versus 27% Republican and 30% independent. By contrast, just 29% of business owners are Democratic, while 31% are Republican and 34% independent.
Bottom Line
Various occupations are hardly homogenous in their demographic or political makeup; their members have a variety of educational backgrounds, reside in all parts of the country, and some are more financially well off than others. However, there appears to be some commonality within some occupational groups that distinguishes their views toward Obama from those of other occupations. This is seen most clearly with service workers, who give Obama higher approval, on average, than any other category of workers. Workers in farming, fishing, and forestry, along with installation/repair workers, transportation workers, and business owners, are markedly lower in their approval of the president -- but even among these groups, majorities approve of Obama's performance in office.
Survey Methods
Results are based on aggregated data from ÆéûÜǨû§Poll Daily tracking for the months of March 2009, April 2009, and May 2009. Each month's aggregated data consist of interviews with more than 30,000 national adults, aged 18 and older, including more than 17,000 adults employed full- or part-time. Results based on specific occupational categories have smaller sample sizes; the May 2009 sample sizes are shown below.
Interviews are conducted with respondents on land-line telephones (for respondents with a land-line telephone) and cellular phones (for respondents who are cell-phone only).
In addition to sampling error, question wording and practical difficulties in conducting surveys can introduce error or bias into the findings of public opinion polls.
